Problem 1. Joe’s income is $100 per week and the price of apples is $2 per apple while the price of books is $10 per book. Joe purchases only apples and books and he uses all of his income.
a. On a graph draw Joe’s budget line with books per week on the vertical axis and apples per week on the horizontal axis. Label your graph carefully and include the numerical values of the y-intercept and x-intercept.
b. Write an equation for Joe’s budget line in y-intercept form where B is books and A is apples.
c. Suppose the price of books doubles while the price of apples and Joe’s income are unchanged. Write an equation in y-intercept form for Joe’s budget line where B is books and A is apples.
Problem 2. Jane’s income is $200 per week and she spends all of her income on pizza and breadsticks. The price of pizza is $10 per pizza and the price of breadsticks is $5 per order.
a. Draw a graph of Jane’s budget line based on the above information you’re been given. On your graph measure pizza per week on the horizontal axis and breadsticks per week on the vertical axis. Label the numerical values of the y-intercept and x-intercept.
b. Using the given information write an equation for Jane’s budget line in y-intercept form where P is pizza and B is breadsticks.
c. Which of the following combinations of pizza and breadsticks can Jane afford? (Put a check in the appropriate column for each of the given combinations.)
Combination Afford Not Afford
10 pizzas, 15 breadsticks
12 pizzas, 5 breadsticks
6 pizzas, 30 breadsticks
5 pizzas, 25 breadsticks
2 pizzas, 38 breadsticks
d. Jane’s utility in general can be expressed as U = BP where U is total utility, B is breadsticks, and P is pizza. Given Jane’s income and the prices of breadsticks and pizza, Jane’s utility is equal to 200 utils when she selects her optimal consumption bundle. What quantity of pizza and breadsticks will Jane consume at this optimal consumption bundle?
e. Draw a graph illustrating Jane’s budget line, indifference curve for a utility level of 200, and her optimal consumption bundle. Label the optimal consumption bundle point A. On the indifference curve identify specifically with numeric values three bundles that lie on the indifference curve.
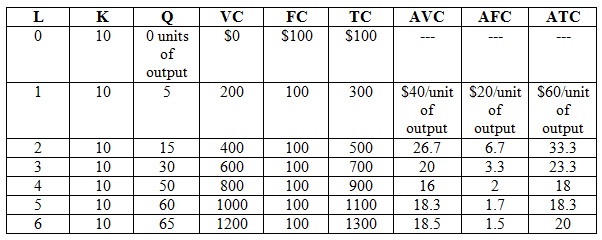
3. You are given the following information about a firm’s production function and cost function. Answer this next set of questions based upon this information. L is labor; K is capital; Q is output; VC is variable cost; FC is fixed cost; TC is total cost; AVC is average variable cost; AFC is average fixed cost; and ATC is average total cost.
a. What is the price of a unit of labor given the above information?
b. What is the price of a unit of capital given the above information?
c. Why does FC stay constant in the table?
d. Why are there no values for AVC, AFC, and ATC on the first row of the table?
e. At what level of output is MC equal to ATC given the information in the above table?