Discuss the below:
Using the Coins Generator feature in the Data menu of the statdisk software, available at statdisk.org, 100 sets of 30 coin tosses were simulated, and the observed number of heads was recorded for each of the 100 trials. The sorted results for the observed number of heads appear below.
8 9 10 10 10 10 10 10 11 11 11 11 12 12 12 12 12 12 12 12
13 13 13 13 13 13 13 13 13 13 13 13 14 14 14 14 14 14 14 14
14 14 14 14 14 14 15 15 15 15 15 15 15 15 15 15 15 16 16 16
16 16 16 16 16 16 16 17 17 17 17 17 17 17 17 17 17 17 17 17
17 17 18 18 18 18 18 18 18 18 18 18 18 19 19 19 20 20 21 23
Q1. Enter the data in a single column in statdisk. Find the sample mean and standard deviation for this data set. Put these values in the space below, rounded to one decimal place accuracy. Please be sure to label which value is which statistic.
Q2. Obtain a histogram for the data using the Auto-fit option in statdisk. Paste a copy of the histogram below, and resize it to fit nicely. Does the shape of the histogram appear to be approximately normal? Why?
Q3. Using the values from question 1 above, use subtraction to compute the observed number of heads that is one standard deviation below the mean, and use addition to compute the observed number of heads that is one standard deviation above the mean. Put these values in the space below, rounded to one decimal place accuracy. Please be sure to label which value is which statistic.
Q4. Using the values from question 3 above and the data values given above, compute the probability that the observed number of heads will be within one standard deviation of the mean by counting the number of items in the data between the two computed values and dividing by the total number of items in the data, which is 100. Compare this value to P( -1 < z < 1) using the central area for z = 1 in the standard normal distribution in statdisk (Analysis, Probability Distributions, Normal Distribution). This is the predicted value that the observed number of heads in 30 coin tosses will be within one standard deviation of the mean if the observed number of heads is normally distributed.
Q5. Using the values from question 1 above, compute the observed number of heads that is two standard deviations below the mean using the formula mean - 2 times the standard deviation, and the observed number of heads that is two standard deviations above the mean using the formula mean + 2 times the standard deviation. Put these values in the space below, rounded to one decimal place accuracy. Please be sure to label which value is which statistic.
Q6. Using the values from question 5 above and the data values given above, compute the probability that the observed number of heads will be within two standard deviations of the mean by counting the number of items in the data between the two computed values and dividing by the total number of items in the data, which is 100. Compare this value to P( -2 < z < 2) using the central area for z = 2 in the standard normal distribution in statdisk (Analysis, Probability Distributions, Normal Distribution). This is the predicted value that the observed number of heads in 30 coin tosses will be within two standard deviations of the mean if the observed number of heads is normally distributed.
Q7. Using the values from question 1 above, compute the observed number of heads that is three standard deviations below the mean using the formula mean - 3 times the standard deviation, and the observed number of heads that is three standard deviations above the mean using the formula mean + 3 times the standard deviation. Put these values in the space below, rounded to one decimal place accuracy. Please be sure to label which value is which statistic.
Q8. Using the values from question 7 above and the data values given above, compute the probability that the observed number of heads will be within three standard deviations of the mean by counting the number of items in the data between the two computed values and dividing by the total number of items in the data, which is 100. Compare this value to P( -3 < z < 3) using the central area for z = 3 in the standard normal distribution in statdisk (Analysis, Probability Distributions, Normal Distribution). This is the predicted value that the observed number of heads in 30 coin tosses will be within three standard deviations of the mean if the observed number of heads is normally distributed.
Q9. Using the values from questions 4, 6, and 8 above, does it appear that the observed number of heads obtained in 30 coin tosses by simulation is approximately normally distributed? Why?
Q10. Using the typical rule that the usual values for the observed number of heads obtained in 30 coin tosses should be within 2 standard deviations of the mean, which values for the observed number of heads obtained in 30 coin tosses would be considered to be unusual using the results from the data and the analysis of the data above?
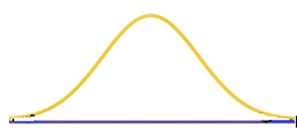
Q11. Assume that the observed number of heads in the sample above is approximately normally distributed. Label the horizontal axis of the graph below with the mean in the middle, and the values from questions 3, 5, and 7 equally spaced starting at the left side of the graph and ending at the right side of the graph. Suggestion: Copy the picture into a drawing editor like paint or into Powerpoint. Add your labels there, then either upload your edited picture as a separate file or paste back the edited picture with your numbers into this document.