Objective: The assignment is intended to enhance students MATLAB stills and to employ the software to solve issues related to signals and systems.
A student is expected to be able to graph various signals. find and graph the convolution of two signals. find the Fourier transform and other signals & system related topics using MATLAB.
Question 1 Graph the following functions:
(a) g(t) = -4 ramp(t) u(t - 2).
(b) g(t) = 3 rect(t/4) - 6 rect(t/2).
Qnestion 2: A periodic signal x(t). with fundamental period To = 6. is described over the time period 0 < t < 6 by
rect (t-2/3)-4rest(t-4/2)
What is the average signal power of this signal?
Question 3:
Graph the signal: g[n] = u[5n].
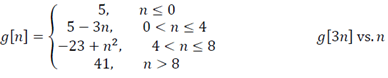
Question 4, Graph the original below function and the scaled function.
|
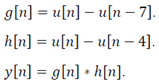
Ouestion 5 Graph the following functions. g[n]=u[n]-u[n-7].
|
|
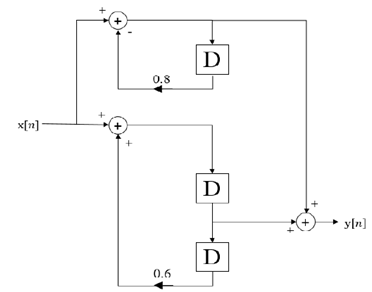
Question 6 Use MATLAB to find, and to graph. the unit-sequence response of the system displayed below.
Question 7 A periodic signal x(t) with a fundamental period of 2 seconds is described over one fundamental period by
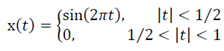
Graph the signal. Then, graph on the same scale the signal xN(t) given by
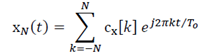
For N = 10, 20 and 30 (In each case the time scale of the graph should cover at least two fundamental periods of the original signal).
Question 8 A signal is defined by x[n] = sinc(n/8). Graph the magnitude and phase of the DTFT of x[n - 2].