Assignment:
1. In the long run
A) the level of output is independent of the price level.
B) the level of output is depends on the price level.
C) price and output levels are mutually dependent.
D) the price level is independent of the level of output.
2. The long-run aggregate supply curve reflects the idea that in the long run, output is determined only by
A) the factors of production.
B) given technology.
C) aggregate demand.
D) both A and B
Refer to the information provided in Figure below to answer the questions that follow.
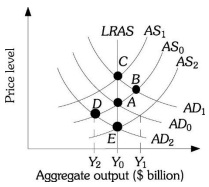
3. Refer to Figure. If the economy is currently at Point D producing output level Y2, which of the following is not true?
A) The economy is operating below full employment.
B) Input prices are likely to fall.
C) Aggregate supply shifts to the right and the economy ends up at Point E.
D) The economy is operating above full employment.
4. Refer to Figure below. Suppose the economy is currently at Point A producing potential output Y0. If the government decreases spending, the economy moves to Point ________ in the short run and to Point ________ in the long run.
A) D; E
B) B; C
C) C; B
D) B; D
5. Refer to Figure. If the economy is currently at Point B producing output level Y1
A) the economy is operating above full employment.
B) input prices are likely to rise.
C) aggregate supply shifts to the left and the economy ends up at Point C.
D) all of the above
6. Explain whether the following government policies affect the aggregate demand curve or the short-run aggregate supply curve and how.
a. The government reduces the minimum nominal wage.
b. The government increases Temporary Assistance to Needy Families (TANF) payments, government transfers to families with dependent children.
c. To reduce the budget deficit, the government announces that households will pay much higher taxes beginning next year.
d. The government reduces military spending.
7. In Wageland, all workers sign annual wage contracts each year on January 1. In late January, a new computer operating system is introduced that increases labor productivity dramatically. Explain how Wageland will move from one short-run macroeconomic equilibrium to another. Illustrate with a diagram.
8. There were two major shocks to the U.S. economy in 2007, leading to the severe recession of 2007-2009. One shock was related to oil prices; the other was the slump in the housing market.
This question analyzes the effect of these two shocks on GDP using the AD-AS framework.
a. Draw typical aggregate demand and short-run aggregate supply curves. Label the horizontal axis "Real GDP" and the vertical axis "Aggregate price level." Label the equilibrium point E1, the equilibrium quantity Y1, and equilibrium price P1.
b. Data taken from the Department of Energy indicate that the average price of crude oil in the world increased from $54.63 per barrel on January 5, 2007, to $92.93 on December 28, 2007.
Would an increase in oil prices cause a demand shock or a supply shock? Redraw the diagram from part a to illustrate the effect of this shock by shifting the appropriate curve.
c. The Housing Price Index, published by the Office of Federal Housing Enterprise Oversight, calculates that U.S. home prices fell by an average of 3.0% in the 12 months between January 2007 and January 2008. Would the fall in home prices cause a supply shock or demand shock? Redraw the diagram from part b to illustrate the effect of this shock by shifting the appropriate curve. Label the new equilibrium point E3, the equilibrium quantity Y3, and equilibrium price P3.
d. Compare the equilibrium points E1 and E3 in your diagram for part c. What was the effect of the two shocks on real GDP and the aggregate price level (increase, decrease, or indeterminate)?
9. The economy is in short-run macroeconomic equilibrium at point E1 in the accompanying diagram. Based on the diagram, answer the following questions.
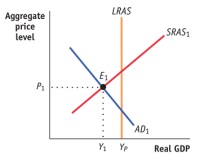
Is the economy facing an inflationary or a recessionary gap?
b. What policies can the government implement that might bring the economy back to longrun macroeconomic equilibrium? Illustrate with a diagram.
c. If the government did not intervene to close this gap, would the economy return to longrun macroeconomic equilibrium? Explain and illustrate with a diagram.