Assignment:
Question 1: Equilibrium price is always determined by _____________________________________and __________________________________.
Question 2: Shortages are associated with price ________________; surpluses are associated with price __________________________________.
Question 3: If supply falls and demand remains the sam, equilibrium price wil _________________, and equilibrium quantity will _________________________.
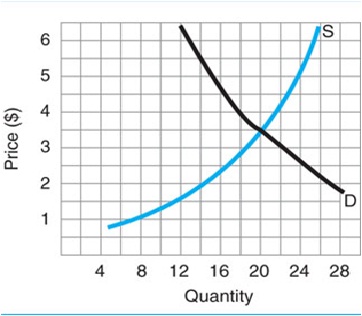
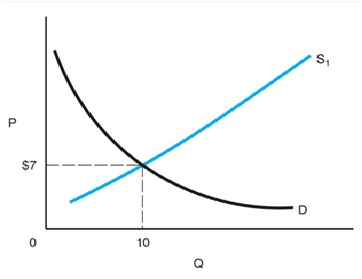
Question 4: Find the equilibrium price and quantity ( in units and dollars, respectfully).
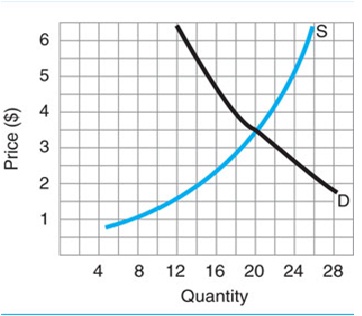
Question 5: Draw in a new supply curve S1, showing a decrease in supply. What happens to equilibrium price and quantity?
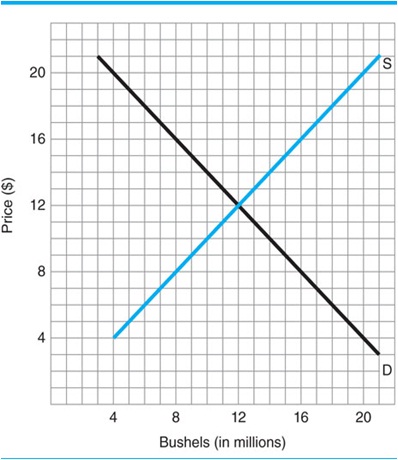
Question 6: (a) Is $16 a price ceiling or price floor? (b) Is there a shortage or a surplus? (c) How much is in (in units of quantity)?

Question 7: (a) Is $12 a price ceiling or price floor? (b) Is there a shortage or a surplus? ( c) How much (in units of quantity)?
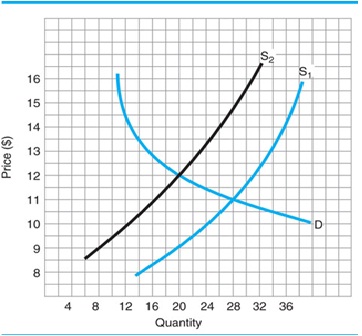
Question 8:
(a). If the supply curve is S1, how much are equilibrium price and quantity?
(b). If the supply changes from S1 to S2, does the represent an increase or decrease in supply?
(c). How much are the new equilibrium price and quantity?
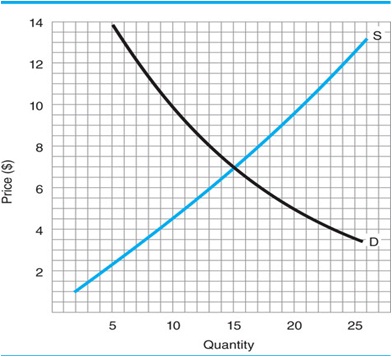
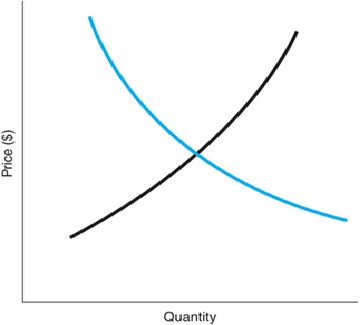
Question 9: A major technological improvement leads to a large decrease in the cost of production. Draw a new supply curve S2, to reflect this change. Then state the new equilibrium price and quantity.
Question 10: (a) Draw a new demand curve, D2, which illustrates a decrease in demand. (b). State what happens to equilibrium price and quantity.
Question 11: Show an increase in demand and a decrease in supply. (a) Label each of the curves (S1, S2, D1 and D2). (b). State the original equilibrium price and quantity. ( c) State the new equilibrium price and quantity.
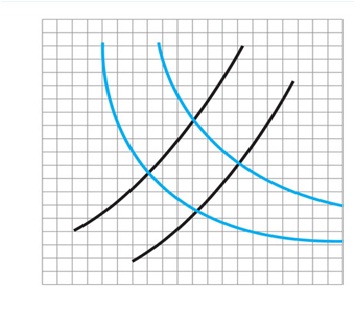
Question 12: The entire orange crop in Florida is affected by a freeze. On the graph show how demand and supply are affected and show the new equilibrium price and quantity for a bushel of oranges.
Question 13: As price rises, quantity supply _________________________ accroding to the Law of Demand.
Question 14: An increase in supply is show graphically by a shift of the supply curve to the _________________________.