ELECTRICITY MODELLING:
This section deals with electricity usage data for 241 households in New Zealand that was collected in 2009. The data is for a single 24 hour period, and has been sampled every 30 minutes. Hence there are 48 measures per household. The first entry is at 12:30am, the second at 1am, and so on. So, for example, the 14th sample is at 7am, and the 24th sample is at midday.
Run the supplied R script power. R, which loads the electricity data and produces a boxplot and example plot for one household. Note that the data is in a data.frame (each row is labelled with each household identifier associated with this data), and that to plot an individual example we turned the individual 48 data points into a numeric vector (as.numeric).
Question 1: Examine the boxplot and briefly discuss the overall pattern of electricity usage for the households.
Question 2: The electricity company is interested in understanding some general patterns of usage so that they can identify different types of user and therefore target them with specific pricing structures. Your task is to identify 4 overall patterns of usage and to identify the outlier households.
Question 3: Identify 2 outlier households and show their pattern of usage. HINT: Use either k-means clustering with about 16 cluster centres (this seems to work well), or a dendrogram with the tree cut into a groupsize of 16, and find those clusters with a single household.
Question 4: Discuss why these 2 outliers appear to be different from the overall general pattern of usage.
Question 5: Determine the general pattern of electricity usage by grouping behaviour into 4 groups, plot them by taking the mean of each group over time, and discuss how they differ. Include a written description of these types of behaviour and what this tells us about each groups typical power consumption usage.
INVESTMENT PORTOLIO MANAGEMENT:
This section deals with modelling the selection of stocks, bonds and cash to make up an investment portfolio. Load the data as follows:
invest <-read.table("invest.tab")
The ROI column is the percentage predicted return on investment, the Risk column is a measure of the risk associated with this particular investment, and the Type indicates the type of investment. Note that each row is labelled with the type of investment and a number, so that you can (if needed) refer to individual investments.
Question 6: Visualise and discuss the different ROI and Risk associated with Stocks, Bonds and Cash.
Run the “invest.R” script. This script does a multi-objective criteria analysis to determine the best mix of stocks, bonds and cash over a range of tradeoffs.
Question 7: Describe in words what the “invest.R” script is doing, what the objective functions are, and what each of the constraints represent.
The table below shows the recommended blend of stocks, bonds and cash for a number of different brokerage houses (i.e. businesses that take your money and invest it to give you a return).
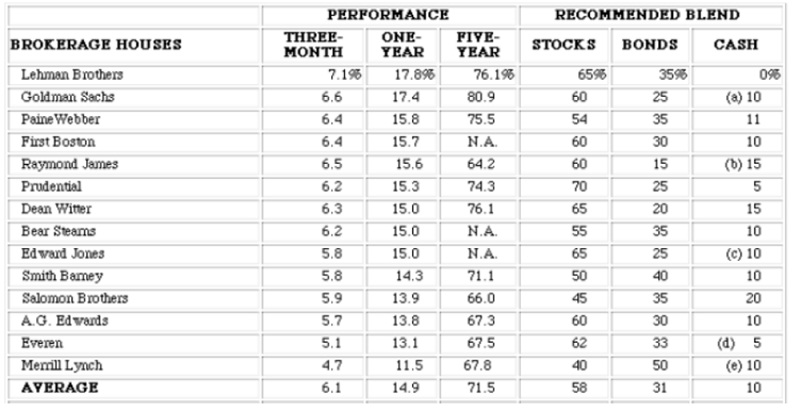
Table: Major brokerage house investment blends (1996). From:
https://pages.stern.nyu.edu/~adamodar/New_Home_Page/invphillectures/port.html
Question 8: Using the result of the nsga2 model, examine and present the blend of stocks, bonds and cash for a low risk, moderate risk and high risk investment blend. Discuss, in relation to Table above, the level of risk that seems to be taken by the brokerage houses and whether the one year return performance is related to the associated risk of the brokerage house.
Question 9: Produce a plot (such as that shown in Figure below) showing how the percentage of bonds, stocks and cash varies as you move along the pareto front from the least to greatest risk. Discuss the patterns you observe and the relationship to Table above. Do the investment houses (Table above) that have the most risky blend receive the best ROI? Which investment house is the most risk adverse?
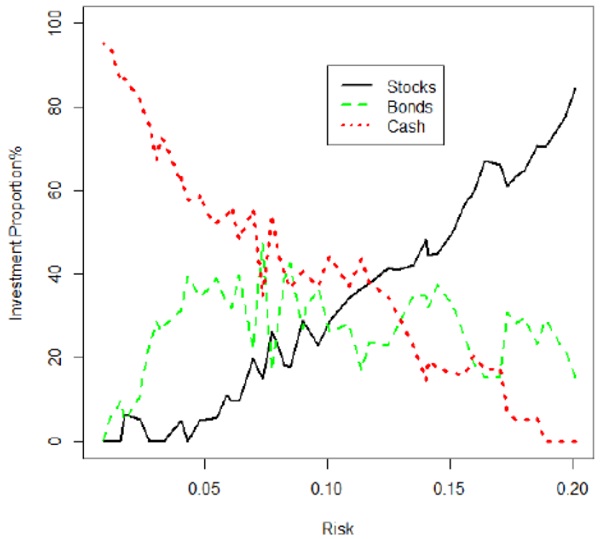
Figure: Plot of Risk versus investment blend as a percentage
Question 10: Assume you only want to investigate the mix of solutions with the ROI between 8.0 and 12.0. State the constraint function that you would define to focus the search space between these ranges of ROI, and produce a plot of the pareto front using this additional constraint. NOTE that it may take several runs before you get the optimal front (the plot will be shown as BLUE DOTS if it has not found the optimal front).