Assignment:
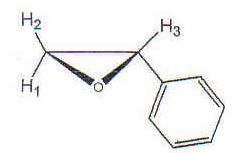
In this problem the H NMR spectrum of styrene oxide shows that protons 1, 2, and 3 all have different chemical shift values. Proton 2 is coupled to both proton 1 (J= 5.8 Hz) and proton 3 (J=2.5 Hz). Draw a scale tree diagram and your best rendering of the resulting peaks for proton 2.

Provide complete and step by step solution for the question and show calculations and use formulas.