Please illustrate step-by-step how to do these.
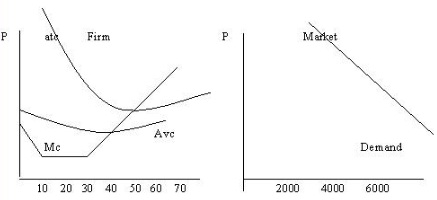
Question 1: In the above diagrams assume the following: MC intersects AVC @ P= $8, Q=40 and MC intersects ATC @ P= $12, Q = 50. (Min MC =$ 4). In the market demand schedule on the right, at a price of $16, the quantity demanded = 6000, and at a price of $12 the quantity demanded rise to 7000.
a) What is the output of a typical firm when the market price is $16?
b) What is the lowest price at which the typical firm will stay in business in the short run?
c) If there are currently 100 firms in this industry. Draw the short run market supply curve.