Question 1. Use the Keynesian Model to answer this set of questions. Suppose that in the economy under consideration the consumption function can be written as C = 100 + .8(Y - T). Furthermore, you know that taxes are autonomous and equal to $20.
a. Draw a graph of the consumption function with respect to disposable income. Measure consumption spending on the vertical axis and disposable income on the horizontal axis. In your graph indicate the value of consumption spending when disposable income is equal to $0, $100, $200, $300, and $400.
b. Now, suppose that government spending is constant and equal to $40 at every level of disposable income. Alter your graph to show the C + G line.
c. Now, suppose that investment spending is constant and equal to $50 at every level of disposable income. Alter your graph to show the C + I + G line.
d. Now, suppose that (X - M) is constant and equal to $10 at every level of disposable income. Alter your graph to show the C + I + G + (X - M) line.
e. Suppose that (a) through (d) are all true for this economy and you also know that full employment output in this economy (Yfe) is equal to $1000. Given this information, what do you predict is happening to inventories if the full employment level of output is produced? Hint: to answer this question you will need to compare this full employment level of output with the level of aggregate expenditure at this level of output.
f. What is the equilibrium level of output for this economy?
g. Suppose that government spending is increased from its initial level to $100. Holding everything else constant, what will be the change in the equilibrium level of output given this spending change?
h. Suppose that government spending is decreased from its initial level by $20. Holding everything else constant, what will be the change in the equilibrium level of output given this spending change?
Question 2. This question is designed to give you some practice working with a consumption function, C = a + b(Y - T), where C is consumption spending, a is autonomous consumption, b is the marginal propensity to consume, Y is real GDP, and T is autonomous taxes. For this problem we will assume that the aggregate price level is fixed and unchanging.
Suppose you are given the following table where (Y - T) is disposable income and Sp is private savings:
|
Y
|
T
|
Y - T
|
C
|
Sp
|
|
0
|
40
|
|
220
|
|
|
100
|
|
|
|
|
|
200
|
|
|
|
|
|
300
|
|
|
|
-185
|
|
400
|
|
|
|
|
|
500
|
|
|
|
|
a. Fill in the missing cells in the above table. Verbally describe how you found the values for the different cells.
b. Suppose in this economy government spending is equal to $50 and investment spending is equal to $60. Furthermore, assume this economy is a closed economy and therefore both exports and imports are equal to $0. What is the value of real GDP in this economy when the economy is in equilibrium? What is the value of consumption when the economy is in equilibrium? What is the value of private savings when this economy is in equilibrium?
c. Suppose you are told that full employment real GDP for this economy is 1500. Given your answer in (b) would you advocate that the government increase or decrease spending if this economy is to reach full employment real GDP using fiscal policy. Assume that only the level of government spending changes in making your policy prescription. What would be the necessary change in government spending to return this economy to full employment?
Question 3. Use the following graph and the Keynesian Model to answer this question. Assume that the aggregate price level is fixed in this problem.
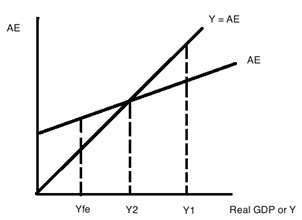
a. Given the above graph, what is the equilibrium level of real GDP for this economy?
b. When the economy is in equilibrium, what do you know about inventories in this economy?
c. When this economy is in equilibrium, what do you know about the relationship between aggregate expenditure and aggregate production?
d. At the equilibrium level of output in the above graph, what do you know about how this economy is performing?
e. When this economy is in equilibrium, what do you know about the unemployment rate compared to the natural unemployment rate? What do you know about the cyclical unemployment rate in this economy?
f. Suppose the government mandates that producers produce Yfe. Assume there have been no monetary or fiscal policy changes to accompany this mandate. Describe the effect of this mandate on this economy given the above graph.
g. Given the situation in the above graph, what policy (policies) do you advocate if the sole goal of the government is to restore this economy to full employment? Explain your reasoning.
Question 4. Use the AD-AS Model to answer this question. For each description assume that the AD-AS Model is initially in long-run equilibrium.
a. Suppose that there is a real estate boom in this economy. Holding everything else constant, what do you predict will happen to real GDP and the aggregate price level in the short run? Holding everything else constant, what do you predict will happen to real GDP and the aggregate price level in the long run? Explain your answer.
b. Suppose that the government in this economy goes to war. Holding everything else constant, what do you predict will happen to real GDP and the aggregate price level in the short run? Holding everything else constant, what do you predict will happen to real GDP and the aggregate price level in the long run? Explain your answer.
c. Suppose that the price of energy decreases in the economy. Holding everything else constant, what do you predict will happen to real GDP and the aggregate price level in the short run? Holding everything else constant, what do you predict will happen to real GDP and the aggregate price level in the long run? Explain your answer.
d. Suppose that the government reduces taxes and at the same time an announcement is made that a major new oilfield has been discovered in western Nebraska and this oilfield is anticipated to be so large that the country no long will need to import oil. Holding everything else constant, what do you predict will happen to real GDP and the aggregate price level in the short run? Holding everything else constant, what do you predict will happen to real GDP and the aggregate price level in the long run? Explain your answer.
Question 5. Suppose that an economy has one bank for the public's financial transactions and a central bank authorized to manage the economy's money supply. In this economy no one holds currency (i.e., there are no currency drains) and all purchases are made by writing checks (or using debit cards). Furthermore, First Providential never holds excess reserves after it makes full adjustment for any monetary policy. There are three people-George, Louis and Frances-that live and work in this economy. The following t-accounts provide us with the initial situation in this economy.
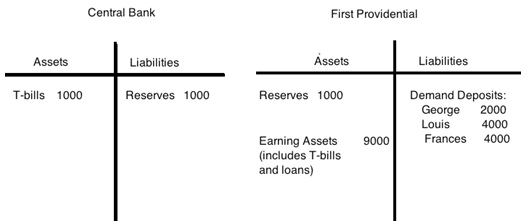
a. Given the above information, what is the required reserve ratio in this economy? Explain how you got your answer.
b. Given the above information, what is the money supply in this economy? Explain how you got your answer.
c. Suppose Louis writes a check in order to purchase $500 worth of camera equipment from George who owns and operates a camera store. Describe the impact of this purchase on First Providential's demand deposits and reserves. Does this purchase affect the Central Bank's t-account? If so, explain all the changes in this t-account.
d. For this question start with the initial t-accounts. Suppose the central bank decides to sell $200 worth of T-bills to First Providential. Show how this decision first impacts these t-accounts before any adjustment with regard to returning to the required reserve levels has been made (show the first round effects of this transaction and not the final full adjustment).
e. Given (d), right after the central bank purchases the T-bills does First Providential have insufficient or excess reserves? Quantify the level of these reserves relative to the required amount for the given amount of demand deposits.
f. Given (d), suppose First Providential approaches George, Louis and Frances and tells them that the bank will need to call in some of the loans that First Providential has made to George, Louis and Frances. At the end of this process First Providential will have no excess reserves and the percentages of total demand deposits held by George, Louis and Frances are the same as they were initially. Draw this final t-account. [Hint: this will be a t-account where First Providential has made full adjustment to the central bank's sale of $200 worth of T-bills.] Show in your answer how you calculated the values in your t-account.
g. Given the transaction in (d), what is the change in the money supply? Provide two different ways (one of these methods should use the money multiplier) to get this change in the money supply.
Question 6. Use the AD-AS Model to answer this set of questions. Suppose you are given the following information:
Long run aggregate supply (LRAS): Yfe = 2500
Short run aggregate supply (SRAS): Y = 250P - 500
Aggregate demand (AD): Y = 4,000 - 200P
where Y is real GDP and P is the aggregate price level.
a. Given the above information, find the short run equilibrium level of real GDP and the aggregate price level.
b. Draw a graph representing the SRAS curve, the AD curve, and the LRAS curve. Label the short run equilibrium.
c. Given your answers in (a) and (b), in this economy in the short run in a boom or a recession? Explain your answer.
d. In the long run, holding everything else constant, what do you predict will happen in this economy?
e. Given the above information, provide a numerical answer for the long run values of real GDP and the aggregate price level in this economy.
f. Given your answers in (d) and (e), provide an equation for the new SRAS curve.
g. At each aggregate price level, what was the decrease in real GDP given your new SRAS curve for (f)?
Question 7. Suppose you are given the following information about an economy:
Required reserve ratio is 5%
Money Supply = Ms: Ms = 12,000
Money Demand = Md: Md = 24,000 - 3000r where r is the interest rate (for this problem we will assume that there are no expectations of inflation so that the nominal interest rate is the same as the real interest rate-this is a simplifying assumption that will make this rather-long problem less complex)
Investment Spending = I: I = 1000 - 100r
Aggregate Expenditure = AE: AE = C + I + G + (X - M)
Consumption Spending = C: C = 200 + .5(Y - T) -100P where P is the aggregate price level
Government Spending = G: G = 200
Net Exports = (X - M): (X - M) = 50
Autonomous Taxes = T: T = 150
Aggregate Demand = AD: AD = AE = Y = C + I + G + (X - M)
Long run Aggregate Supply = LRAS: LRAS = Yfe = 1725
Short run Aggregate Supply = SRAS: Y = 287.50P
a. There is a lot of information given to you in this problem. There is information about the money market; information about aggregate expenditure; and information about the AD, LRAS and SRAS curves. Take a moment and look at this information carefully. Now, focus on the consumption function: what does consumption spending depend upon in this economy? What is the relationship between consumption spending and disposable income (e.g., is it a positive or negative relationship)? What is the relationship between consumption spending and the aggregate price level? Do both of these relationships seem plausible to you? Explain your reasoning.
b. Given the above information, what is the equilibrium interest rate in this economy? Explain how you found this interest rate.
c. Given the above information, what is the level of investment spending in this economy? Explain how you found this level of spending.
d. Given the above information, calculate an equation that expresses this economy's aggregate demand for goods and services.
e. Given the above information and your work in (a) through (d), find the short run equilibrium level of real GDP (Y) and the short run aggregate price level (P). Then draw a graph illustrating this short run equilibrium. In your graph include the LRAS curve as well. Measure the aggregate price level on the vertical axis and real GDP on the horizontal axis.
f. Suppose the government sets a goal of using fiscal policy to reach the full employment level of output. If the government changes the level of government spending to reach this goal, how much will government spending need to change by holding everything else constant? After you compute the change in government spending, use this new level of spending to recalculate the equilibrium level of real GDP and see if your answer is correct. (Hint: the simple multiplier calculation will result in "too small" a level of stimulus since the aggregate price level will change when the AD curve shifts.) Show your work and your computations.
g. Suppose the government sets a goal of using fiscal policy to reach the full employment level of output. If the government changes the level of autonomous taxes to reach this goal, how much will the autonomous taxes need to change by holding everything else constant? After you compute the change in autonomous taxes, use this new level of taxes to recalculate the equilibrium level of real GDP and see if your answer is correct. (Hint: the simple multiplier calculation will result in "too small" a level of stimulus since the aggregate price level will change when the AD curve shifts.) Show your work and your computations.
h. Suppose the government, for political reasons, finds that fiscal policies are simply not possible to implement in this economy. But, the government is still determined to restore this economy to Yfe, perhaps because the government is concerned with the social instability that high levels of unemployment may create, or because the government is morally concerned about the impact of high unemployment on people in their society, or because....(fill in your own rationale).The government sets a goal of using monetary policy to reach the full employment level of output. Can the government reach this goal using only monetary policy? In your answer remember that it is not possible to have the nominal interest rate go below 0%. Holding everything else constant, what is the highest level of real GDP this economy can attain if the government engages in activist monetary policy? (Hint: you will definitely need your calculator on this one!) And, what will be the monetary policy that is implemented to reach this level of real GDP? In your answer to this last question be specific with the type of policy as well as providing a quantitative number for this policy.