1. Initially state whether the following variables are categorical or numeric. If you say 'categorical', then state whether the variable is nominal or ordinal; if you say 'numeric', then state whether the variable is discrete or continuous.
a. Letter grade in the last class you took as an undergraduate
b. Number of traumatic life events experienced by a study subject
c. Eye color
d. Time required to perform surgery
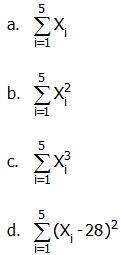
2. Age is recorded for five graduate students: 25, 38, 28, 23, 26. Calculate the following:
3. In a sample of 54 patients, 30 live in Richland County, 15 live in Lexington County, 6 live in Kershaw County, and 3 live in Calhoun County. For this data:
a. Accurately draw a bar chart. For this and the pie chart in part (c), you can do this by hand, use Excel, etc.
b. Calculate the angles for a pie chart.
c. Accurately draw the pie chart. What can you see in this pie chart that was not as obvious in the bar chart?
4. The number of heart beats in a 5-minute period are recorded for 25 women not using a certain drug, and 16 women using this drug. The data are:
No drug: 293 297 300 302 306 311 312 314 318 320 322 323 324
324 326 327 331 333 335 339 342 345 345 351 356
Drug: 330 331 335 337 339 343 346 349
350 358 364 369 375 387 398 403
For parts (a, b, & c), use classes of 290 - 299, 300 - 309, 310 - 319, 320 - 329, etc.
a. Draw a back-to-back stem-and-leaf plot, with drug users on the right (order the "leaves").
b. For the 25 women not using the drug, create a frequency table.
c. Again for the 25 women not using the drug, draw a histogram.
d. For each group, calculate the 5-number summary (minimum, LQ, median, UQ, and maximum). It would be best to show your work, for possible partial credit.
e. Using the results of part (d), accurately draw side-by-side box plots.
f. Using the information from parts (a) and (e), discuss similarities and differences between the two data sets. There should be three things you look at when comparing these - location, variation, and general shape.
g. Classify the number of beats into three categories: "Normal" (< 325), "Fast" (326 - 350), and "Very Fast" (> 351). Create a two-way table with drug use and this new categorical variable, then briefly comment on anything of interest that you see in the table.