Assignment:
Using the below graph discuss the following:
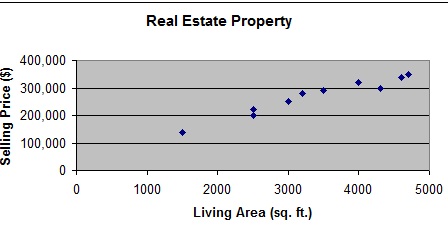
1. The dependent variable shown in the plot is the selling price of the real estate property.
2. The plot shows a total of 10 pairs of observations that incorporate the two variables, living area and selling price.
3. The relationship between the two variables, living area and selling price, is such that a decrease in living area is accompanied by a decrease in selling price.
4. There is likely a strong relationship between the two variables, living area and selling price, so a linear model is appropriate.
5. Assuming the data was derived from a subdivision of houses, one would expect to see a selling price of $300,000 for a house that has 2,200 sq. ft. of living area.