Complete the mcq:
1. Probability Type
A ___________ probability is the probability that an event occurs given that another event has already occurred.
a) joint
b) marginal
c) conditional
d) exclusive
2. Probability of Multiple Events
Jim is considering pursuing an MS in Information Systems degree. He has applied to two different universities. The acceptance rate for applicants with similar qualifications is 20% for University X and 45% for University Y. What is the probability that Jim will be accepted at both universities?
a) .65
b) .25
c) .20
d) .09
3. Binomial Probability
A fair die is rolled nine times. What is the probability that an odd number (1,3 or 5) will occur less than 3 times?
a) .0899
b) .2544
c) .7456
d) .9101
4. Normal Probability Distribution
A loaf of bread is normally distributed with a mean of 22 oz and a standard deviation of 0.5 oz. What is the probability that a loaf is less than 22.25 oz?
a) .1915
b) .3085
c) .6915
d) .7257
5. Normal Probability Distribution II
The metropolitan airport commission is considering the establishment of limitations on noise pollution around a local airport. At the present time, the noise level per jet takeoff in one neighborhood near the airport is approximately normally distributed with a mean of 100 decibels and a standard deviation of 3 decibels. What is the probability that a randomly selected jet will generate a noise level of more than 105 decibels?
a) 0.0228
b) 0.0475
c) 0.0500
d) 0.0512
6. Joint Probabilities
Employees of a local company are classified according to gender and job type. The following joint frequency table summarizes the number of people in each job category.
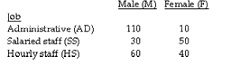
If an employee is selected at random, what is the probability that the employee is male and salaried staff?
a) 0.015
b) 0.100
c) 0.167
d) 0.267
7. Find the Conditional Probability
Employees of a local company are classified according to gender and job type. The following table summarizes the number of people in each job category.
If an employee is selected at random, what is the probability that the employee is female given that the employee is a salaried staff member.
a) .1667
b) .50
c) .60
d) .625
8. Decision Making without Probabilities
The local operations manager for the IRS must decide whether to hire 1, 2, or 3 temporary workers. He estimates that net revenues will vary with how well taxpayers comply with the new tax code.
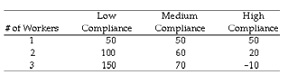
If he uses the maximin criterion, how many new workers will he hire?
a) 1
b) 2
c) 3
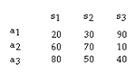
9. Expected Value of Perfect Information EVPI
The quality control manager for ENTA Inc. must decide whether to accept (a1), further analyze (a2) or reject (a3) a lot of incoming material. Assume the following payoff table is available. Historical data indicates that there is 30% chance that the lot is poor quality (s1), 50 % chance that the lot is fair quality (s2) and 20% chance that the lot is good quality (s3).
What is the maximum amount that you would be willing to pay for perfect information?
a) 20
b) 39
c) 57
d) 77
10. Decision Tree Expected Value
Consider the following decision tree.
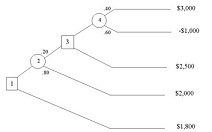
What is the expected value at node 4?
a) 600
b) 1600
c) 1800
d) 2500
11. Decision Tree Expected Value II
Use the decision tree from question 10.
What is the value associated with node 3?
a) 600
b) 1600
c) 1800
d) 2500
12. Expected Value of Perfect Information II
A business owner is trying to decide whether to buy, rent, or lease office space and has constructed the following payoff table based on whether business is brisk or slow.
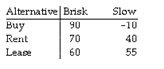
If the probability of brisk business is .40 and for slow business is .60, determine the expected value of perfect information is:
a) 12
b) 55
c) 57
d) 69
13. Fill-in-the-blank
The __________ of sample information is the difference between the expected value with and without additional information.
a) efficiency
b) utilization
c) expected value
d) events
14. Fill-in-the-blank II
The __________ of sample information is the ratio of the expected value of sample information to the expected value of perfect information.
a) utilization
b) expected value
c) efficiency
d) events
15. Find the Simulation Value
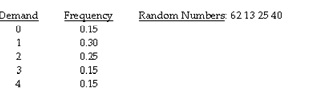
If a simulation begins with the first random number, what would the first simulation value be? (Hint: The random numbers are chosen from 0 - 100 with uniform distribution, so divide each random number by 100.)
a) 1
b) 2
c) 3
d) 4
16. Find the Simulation Value II
Given this frequency distribution, the random number 0.61 would be interpreted as a demand of:
a) 0
b) 1
c) 2
d) 3
17. Complete the Simulation
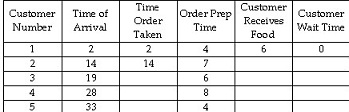
A graduate research assistant "moonlights" at the short order counter in the student union snack bar in the evenings. He is considering asking for help taking orders, but needs to convince the management that they should hire another student. Because he is taking a simulation class, he thinks it may be the perfect way to convince management to hire more help if he can show that customers have to wait a long time. When a customer arrives, he takes their order and their payment, prepares the food, gives it to the customer, and then takes the order from the next person in line. If someone arrives while he's cooking an order, they have to wait until he's completed the current order. He has simulated 5 orders.
Average customer waiting time is:
a) 1 minute
b) 2 minutes
c) 2.5 minutes
d) 3.0 minutes
18. Fill-in-the-blank II 2
The __________ method is the most common type of forecasting method for the long-term strategic planning process.
a) time series
b) regression
c) qualitative
19. Computer the Moving Average
Given the following data on the number of pints of ice cream sold at a local ice cream store for a 6-period time frame:
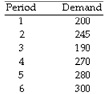
You are at the beginning of period 6. Compute a 3-period moving average forecast for this period.
a) 246.67
b) 247.50
c) 283.33
d) 300
20. Compute 5-month Moving Average
Given the following data on the number of pints of ice cream sold at a local ice cream store for a 6-period time frame:
You are at the beginning of period 6. Computer a 5-month moving average forecast for this period.
a) 237.0
b) 247.5
c) 257.0
d) 300.0
21. Find the Average Forecast Error
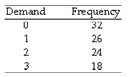
The following data summarizes the historical demand for a product
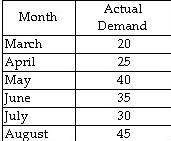
Determine the average forecast error when using the 4-month moving average method.
a) 5.25
b) 5.75
c) 6.25
d) 6.75
22. Find the weighted average
The following data summarizes the historical demand for a product
Use a weighted moving average method with weights w1 = .2, w2 = .3 and w3 = .5 and determine the forecasted demand for September.
HINT: Remember that the first weight refers to the most recent month.
a) 33.5
b) 35.5
c) 37.5
d) 38.5
23. Forecast Using Linear Regression
Robert wants to know if there is a relation between money spent on gambling and winnings:
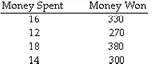
If he spends $20, how much can he expect to win if he uses regression analysis?
a) 320
b) 370
c) 410
d) 450
24. Forecast Pattern Type
__________ is an up-and-down repetitive movement within a trend occurring periodically.
a) Prediction
b) Seasonal pattern
c) Trend
d) Cycle
25. Choose the Correct Method Type
__________ attempt to develop a mathematical relationship between the item being forecast and factors that cause it to behave the way it does.
a) Qualitative methods
b) Regression
c) Time series
d) Quantitative methods
26. Determine the graph trend type
Consider the following graph of sales.
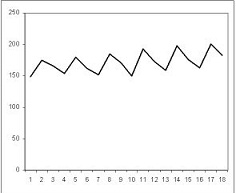
Which of the following characteristics is exhibited by the data?
a) Cyclical only
b) Trend plus cyclical
c) Trend plus seasonal
d) Seasonal only
27. Determine Type of Averaging Method
__________ is an averaging method that reacts more strongly to recent changes in demand.
a) Weighted moving average
b) Exponential smoothing
c) Linear Trend Line
d) Moving average
28. Simple Exponential Smoothing
Given an actual demand of 59, a previous forecast of 64, and an alpha of .3, what would the forecast for the next period be using simple exponential smoothing?
a) 57.5
b) 60.5
c) 62.5
d) 65.6
29. Determine the Regression Equation
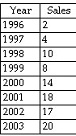
Consider the following annual sales data for 1996-2003, use the linear regression method and determine the estimated sales equation. HINT: Remember to use period numbers. Refer to your book's example on the linear trend line.
a) y = 2.63 + 0.21x
b) y = 2.63 - 0.21x
c) y = -0.21 + 2.63x
d) y = 0.21 - 2.63x
30. Cause-Effect Relationship
Consider the following annual sales data for 1996-2003. This is the same table shown in the previous question. Determine the percentage of in the variation of sales that can be attributed to the year.
a) 91.54%
b) 93.22%
c) 95.34%
d) 96.55%
31. Extra Credit I - Normal Distribution
The law firm of Dewey, Cheetham, and Howe has a pool of candidates wishing for internship in the law firm. The law firm has decided to test each candidate on his or her ability to win a nuisance lawsuit. Candidates who score in the top 33% will be given an internship. The law firm has issued similar tests in the past and knows that the average score is 80 (out of 100), the standard deviation is 10, and that test scores are normally distributed. What is the minimum score that a candidate must earn in order to place in the top 33%?HINT: In a normal situation, you would be given the x-value and would determine the area under the normal curve. Here, you are given the area under the normal curve and must determine the x-value.
a) 81.25
b) 84.40
c) 86.30
d) 88.60
32. Extra Credit II - Bayesian Analysis
An airline is trying to determine whether the price of fuel will rise or fall in the near future in order to determine whether to negotiate a fuel contract now or later. The airline executives believe there is an 65% chance that the cost of fuel will fall. However, they are risk-averse and would prefer to hire an analyst to obtain more information. The airline executives have found that when the price of fuel fell, the analyst correctly predicted the decrease in cost 90% of the time. When the price of fuel rose, the analyst correctly predicted the increase 75% of the time. The executives hired the analyst, and the analyst issued a report predicting that the cost of fuel would fall. What is the probability that the price of fuel will fall given the analyst prediction of such a decrease? You should carry your calculations to 4 decimal places and round of your answer to 2.
a) .65
b) .68
c) .74
d) .87
33. Extra Credit III - Forecast Errors
This question requires some thought, but the correct answer can be reached if you think long enough about it.You are performing an analysis of your chosen forecasting method and have tracked errors for forecasts over the previous 24 time periods. You have obtained the following results from your error analysis:MAD = 25
MAPD = 0.10
E (Cumm. error) = 5What might you conclude about your forecasts?
a) Forecasts are consistently above the actual demand.
b) Forecasts are consistently below the actual demand.
c) Forecasts fluctuate wildly above and below the actual demand.