Assignment:
Applied Example
It has long been known that a student's ability to pass the state's fourth-grade proficiency tests is closely related to the income level in the student's home.
The accompanying chart shows how individual elementary schools performed in the March 2000 proficiency tests in fourth-grade math and reading-and whether the schools performed better or worse than could be predicted based on the poverty level of the students attending the school.
The percentage of children receiving free or reduced-price lunches was used as the measure of poverty.
Poverty predicts scores
Each of 2,025 elementary schools in Ohio analyzed by The Blade is represented on this chart as a single dot. The dots were located on the chart based on each school's poverty level compared with each school's overall passage rate on the state's fourth-grade reading proficiency test.
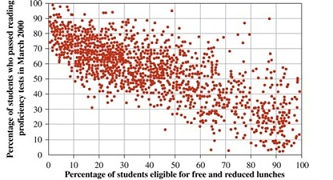
Based on the preceding paragraph and the graph, the two variables that are examined in this example are "school's poverty level" and "passage rate." The scatter diagram clearly shows that a pattern exists. Note that the dots are all clustered together, sloping in a downward manner. Therefore, as the poverty level increased (read x-axis from left to right), the passage rate decreased.
a. What are the two variables used?
b. Does the scatter diagram suggest a relationship between the two variables? Explain.
c. What conclusion, if any, can you draw from the appearance of the scatter diagram?