Discuss the below:
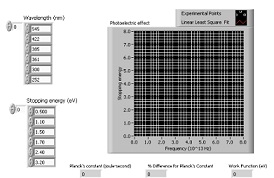
Q. In the photoelectric effect experiment, light photons strike a photoelectric material in a phototube and electrons are emitted with a certain kinetic energy. If the stopping energy of the electrons is graphed as a function of the frequency of light, then the slope of the line will be Planck's constant and the y-intercept will be the work function for the material. Construct and document create VI that will read the following experimental data from an Excel file and plot stopping energy of the electrons versus frequency of the light. Also use the LABVIEW linear least squares Sub VI to fit the experimental data to a straight line. From the output of the Sub VI you can get the slope, intercept, and best line to use to determine Planck's constant, the work function, and the theoretical line to graph. Use the Front Panel shown here as a guide for designing your VI..
Wavelength of light (nm) Stopping Energy of electrons (eV)
545 0.50
422 1.10
385 1.50
361 1.70
300 2.40
252 3.20.
