Problem 1: Use the following diagram of a production possibilities frontier for Macroland to answer the following set of questions. Assume that Macroland produces only two types of goods, capital goods (K) and consumer goods (C).
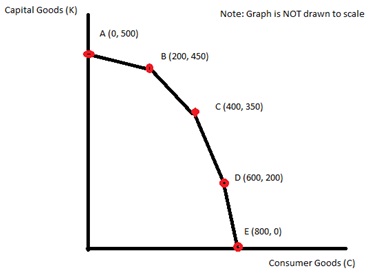
a) What is the opportunity cost of producing 50 more units of capital goods if the economy of Macroland is currently producing at point B?
b) What is the opportunity cost of producing 50 more units of consumer goods if the economy of Macroland is currently producing at point B?
c) What is the opportunity cost of producing 1 more unit of capital goods if the economy of Macroland is currently producing at point C?
d) What is the opportunity cost of producing 1 more unit of consumer goods if the economy is currently producing at point D?
e) Suppose that there is a technological improvement in producing consumer goods that results in twice as many units of consumer goods being produced from the available resources in Macroland. Draw the new production possibility frontier for Macroland given this change. Assume that there are no changes in technology with regard to capital good production.
Problem 2: Amazonia and Noblia are two countries that each produce zippers (Z) and hats (H). From its available resources and technology Amazonia can produce 100 zippers and 0 hats or 0 zippers and 200 hats or any combination of zippers and hats that sits on Amazonia’s linear PPF. From its available resources and technology Noblia can produce 50 zippers and 0 hats or 0 zippers and 50 hats or any combination of zippers and hats that sits on Noblia’s linear PPF.
a. On two separate graphs draw the PPF for Amazonia and Noblia. Measure zippers on the vertical axis and hats on the horizontal axis.
b. Write an equation in slope-intercept form for the PPF for Amazonia.
c. Write an equation in slope-intercept form for the PPF for Noblia.
d. What is Amazonia’s opportunity cost of producing 1 hat? What is Noblia’s opportunity cost of producing 1 hat? Which country has the comparative advantage in producing hats?
e. What is Amazonia’s opportunity cost of producing 1 zipper? What is Noblia’s opportunity cost of producing 1 zipper? Which country has the comparative advantage in producing zippers?
f. Draw the joint PPF for Amazonia and Noblia. On this graph make sure you identify the coordinates of any endpoint as well as the coordinates for any “kink” point.
g. What is the range of trading prices that are acceptable to both countries for 10 zippers?
h. What is the range of trading prices that are acceptable to both countries for 5 hats?
Problem 3. Each of the following situations is independent of the other situations. For each draw a graph illustrating the situation and do the requested analysis.
a. Consider the market for soft drinks that is initially in equilibrium with a market price of P1 and a market quantity of Q1. Suppose there is a successful campaign to educate the public about the caloric values in soft drinks and their contribution to obesity. At the same time suppose that the price of corn syrup, a key ingredient in many soft drinks, rises. Draw a graph illustrating the initial equilibrium and the new equilibrium after these described changes. Provide a verbal description of the outcome in this market due to these changes.
b. Consider the market for mass transit that is initially in equilibrium with a market price of P1 and a market quantity of Q1. Suppose that after Hurricane Sandy swept through the Atlantic states that New York City officials mandated that all cars coming into New York City must have at least three occupants at all times, otherwise individuals wishing to travel in New York City would need to take mass transit during the weeks of clean-up from this storm. Analyze the impact of this edict from city officials on the market for mass transit. Provide a graph of your analysis and also a verbal description of how the equilibrium price and equilibrium quantity responded to this edict.
c. Consider the market for gasoline that is initially in equilibrium with a market price of P1 and a market quantity of Q1. Suppose that there is a war in the Middle East that disrupts petroleum production (petroleum is a major input to the production of gasoline) while at the same time people’s incomes in the United States increases. Assume gasoline is a normal good. Draw a graph illustrating the initial equilibrium and the new equilibrium after these described changes. Provide a verbal description of the outcome in this market due to these changes.
d. Consider the market for noodles that is initially in equilibrium with a market price of P1 and a market quantity of Q1. Noodles are an inferior good. Suppose that people’s incomes fall due to the financial crisis. Draw a graph illustrating the initial equilibrium and the new equilibrium after the described changes. Provide a verbal description of the outcome in this market due to these changes.
Problem 4. Romia is a small, closed economy that produces pianos. Currently the domestic demand for pianos in Romia is given by the equation P = 2000 – 2Q while the domestic supply for pianos in Romia is given by the equation P = 200 + 4Q.
a. Given the above information calculate the equilibrium price and equilibrium quantity in the market for pianos in Romia. Then, calculate the value of consumer surplus (CS) and producer surplus (PS).
b. Suppose that Romia is considering opening its piano market to trade and that the world price of pianos is $1500.
c. Given this information, analyze the effect on Romia of opening its piano market to trade. In your answer be sure to comment on how this decision will impact imports or exports of pianos in Romia while also commenting on how many pianos domestic consumers will purchase if the market opens to trade and how many pianos domestic producers will produce if the market opens to trade. In addition, calculate the values of CS with trade and PS with trade.
d. Is opening this market to trade beneficial for Romia? Fully explain your answer to this question.
Suppose that Romia is considering opening its piano market to trade and that the world price of pianos is $800.
e. Given this information, analyze the effect on Romia of opening its piano market to trade. In your answer be sure to comment on how this decision will impact imports or exports of pianos in Romia while also commenting on how many pianos domestic consumers will purchase if the market opens to trade and how many pianos domestic producers will produce if the market opens to trade. In addition, calculate the values of CS with trade and PS with trade.
f. Is opening this market to trade beneficial for Romia? Fully explain your answer to this question.
g. Now, suppose the market for pianos in Romia is opened to trade and the world price is $800 per piano. Use this information and the equations for the domestic demand and domestic supply curves to answer the net set of questions.
h. Given this information, suppose you are told that the government has enacted a tariff that resulted in the government receiving $60,000 in tariff revenue. By how much did the tariff raise the price of pianos given this information? Hint: if you do this correctly you should find that there are two different tariffs that Romia could apply in this market to get this level of tariff revenue.
i. Given your two answers in (f) go back and calculate the value of imports under each tariff price and then prove numerically that both tariffs result in tariff revenue of $60,000.
Problem 5. Consider the small, closed economy of Exurbia. Exurbia produces mittens and the domestic market demand and domestic market supply curves for mittens in Exurbia are as follows where Q is pairs of mittens and P is the price per pair of mittens:
Domestic Demand: Q = 20,000 – 2000P
Domestic Supply: Q = 2000P – 4000
a. For the closed economy of Exurbia calculate the equilibrium price and equilibrium quantity of mittens, as well as the value of consumer surplus (CS) and producer surplus (PS). Then draw and label a graph depicting the closed market for mittens in Exurbia.
b. Now, suppose that the economy of Exurbia opens its mittens market to trade. Furthermore suppose that the world price of mittens is $3 per pair of mittens. Find the level of imports when Exurbia opens this market to trade. In addition find the quantity demanded domestically, the quantity supplied domestically, the value of CS with trade, and the value of PS with trade. Then draw and label a graph depicting the open market for mittens in Exurbia. Is opening this market to trade beneficial for Exurbia? Explain your answer.
c. Now, after opening this market to trade, the government of Exurbia decides to implement a quota in this market. They decide to impose a quota of 2000 pairs of mittens in this market. Find the level of imports when Exurbia opens this market to trade and imposes this quota. In addition find the quantity demanded domestically, the quantity supplied domestically, the value of CS with the quota, the value of PS with the quota, the license holder revenue due to the quota, and the deadweight loss associated with the quota. Then draw and label a graph depicting this quota in the market for mittens in Exurbia.
Problem 6. In Boomtown government officials are considering implementing an excise tax on the producers of tennis balls. They have called you in to analyze the impact of this proposed tax. Currently (before the excise tax) market demand and market supply of tennis balls is given in Boomtown are given by the following equations where P is the price per case of tennis balls and Q is the quantity of cases of tennis balls:
Market Demand: P = 90 – (3/2)Q
Market Supply: P = 20 + (1/4)Q
The government officials propose implementing an excise tax of $7 per case of tennis balls on producers. Use this information to answer the following set of questions. Be sure to show how you got your answers.
a. Intuitively, implementation of this tax will cause which curve in our demand and supply graph to shift? Explain the direction of this shift and how this shift will impact equilibrium price and equilibrium quantity in this market once the excise tax is imposed.
b. With the imposition of this excise tax, how much tax revenue will be collected by the government in Boomtown?
c. With the imposition of this excise tax, what will be the change in consumer surplus relative to the initial level of consumer surplus?
d. With the imposition of this excise tax, what will be the change in producer surplus relative to the initial level of producer surplus?
e. What is the deadweight loss due to this excise tax? Verify that the sum of (CS with the tax + PS with the tax + Tax revenue + Deadweight Loss) is equal to the value of total surplus prior to the imposition of the excise tax. (If it is not, then you have made a math error and you need to redo the problem to correct this error.)
f. Calculate the consumer tax incidence (CTI) and the producer tax incidence of this excise tax. Who bears the greater economic burden of this excise tax? Explain your answer.
g. Suppose the government would like to decrease consumption of tennis balls to 28 cases. How big an excise tax would the government need to implement to reach this goal?