Assignment:
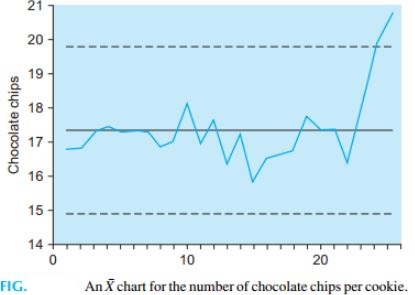
Consider the X chart shown in Fig. showing the average number of chocolate chips per cookie.
a. Describe in general terms what you see in the chart.
b. Decide whether or not this process is in control. Give a reason for your answer.
c. What action, if any, is warranted?
Provide complete and step by step solution for the question and show calculations and use formulas.