Assignment:
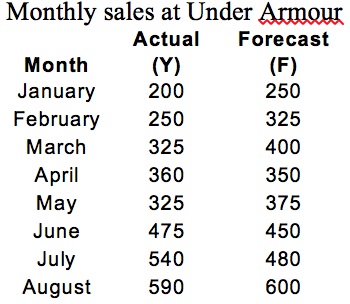
A particular forecasting model was used to forecast sales of a product at Under Armor from January to August of 2016. The following table provides the actual demand and forecasts for January through August data.
Use POM to find the following measures of forecast accuracy:
a. Mean absolute deviation (MAD) and Mean absolute percentage error (MAPE)
b. Compute in POM and plot in MS EXCEL the tracking signal for this period. State whether you think the model being used is giving acceptable forecasts. The forecaster would regard the forecasts to be in control as long as the tracking signals are within +/- 3 MAD.
c. Derive a new forecast for January thru August using exponential smoothing and only the forecast for January (use the best value for alpha). Calculate (MAD) and (MAPE)
d. Using the computed tracking signal from POM, plot it in MS Excel and state whether you think this model is giving acceptable forecasts, (acceptable is +/-3 MAD)
e. Compare the two forecasts and indicate which one is the better forecasting method and why. Explain all elements (Include all forecast errors (MSE, MAD, MAPE), tracking signal and forecast graph.