Assignment:
Control Charts- X chart, R chart, c chart, p chart
1) The Canine Gourmet Company produces delicious dog treats for canines with discriminating tastes. Management wants the box-filling line to be set so that the process average weight per packet is 45 grams. To make sure that the process is in control, an inspector at the end of the filling line periodically selects a random box of 10 packets and weighs each packet. When the process is in control, the range in the weight of each sample has averaged 6 grams.
a. Design an R- and x-chart for this process.
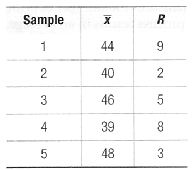
b. The results from the last 5 samples of 10 packets are below. Is the process in control? Explain.
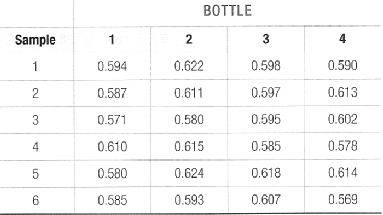
2) Aspen Plastics produces plastic bottles to customer order. The quality inspector randomly selects four bottles from the bottle machine and measures the outside diameter of the bottle neck, a critical quality dimension that determines whether the bottle cap will fit properly. The dimensions (inches) from the last six samples are : (see attachment)
a. Assume that only these six samples are sufficient, and use the data to determine control limits for an R and an X chart
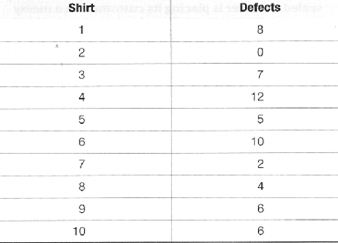
3) Jim's Outfitters, Inc. makes custom fancy shirts for cowboys. The shirts could be flawed in various ways, including flaws in the weave or color of the fabric, loose buttons or decorations, wrong dimensions, and uneven stitches. Jim randomly examined 10 shirts, with the following results: (see attachment)
a. Assuming that 10 observations are adequate for these purposes, determine the three-sigma control limits for defects per shirt.
b. Suppose that the next shirt has 13 flaws. What can you say about the process now?
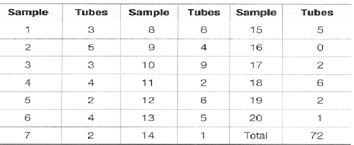
4) Management at Webster, in Problem 16, is now concerned as to whether caulking tubes are being properly capped. If a significant proportion of the tubes are not being sealed, Webster is placing its customers in a messy situation. Tubes are packaged in large boxes of 144. Several boxes are inspected, and the following numbers of leaking tubes are found: (see attachment). Calculate p-chart three sigma control limits to assess whether the capping process is in statistical control