Discuss the below:
Section 1. Each year the local country club sponsors a tennis tournament. Play starts with 128 participants. During each round, half of the players are eliminated. How many players remain after 5 rounds? Chart the decay rate.
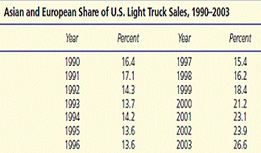
Section 2. Given the following data:
(a) Plot the market-share data [put the year in 1, 2, 3 ...series, 1990 = 1). Input the data in Excel. Show the percent input range. Select Insert menu and choose line chart. Year should be plotted on the horizontal axis and percent on the vertical axis].
(b) Describe the trend (if any) and discuss possible causes.
(c) Fit three trends (linear, exponential, quadratic). [Right click on the chart, select add trendline. Choose from the non-linear trends listed on the top. At the bottom, check the box - add equation on the trendline. Clic ok].
(d) Which trend model is best, and why? If none is satisfactory, explain.
(e) Make a forecast for 2004 by using a trend model of your choice or a judgment forecast.