Discuss the below:
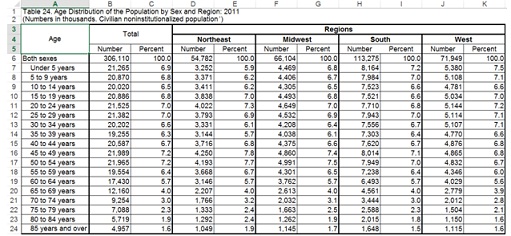
The 123 text covered dependency ratios for the total population of the United States. The snapshot below is a spreadsheet that also separates the population into regions.

Q1. You will need to select a region to use to complete the questions below. Refer to your book if necessary.
a. Which region will you be using for your calculations? ______________
Q2. Note the age groupings in the table, it will be helpful to regroup the ages to calculate dependency ratios.
a. What is the total population for the under-15 year olds for your region?
b. What is the total population for the 15-64 year olds for your region?
c. What is the total population for the over-65 year olds for your region?
Q3. Calculate the ratio of under-15 year-olds to the total population of the selected region.
a. What kind of ratio is this: a part to part or part to whole?
b. Write the ratio in at least 2 ways.
c. Use this ratio in a meaningful sentence.
Q4. Calculate the ratio of age 65-and-over to the total population of the selected region.
a. What kind of ratio is this: a part to part or part to whole?
b. Write the ratio in at least 2 ways.
c. Use this ratio in a meaningful sentence.
Q5. If you write the ratios from the last two questions as decimals and multiply 100 you can express the ratios as "per hundred" or a percent.
What percent of the total population would be classified as "child dependent"?_______
What percent of the total population would be classified as "old-age dependent"_______
Q6. Child dependency ratio.
a. Explain how to calculate a child dependency ratio (you may want to refer to your notes, this is not the same as what was calculated above).
b. Find the child dependency ratio for your selected region.
c. Use the ratio in a sentence to explain its meaning.
d. Write a sentence explaining the meaning of the ratio with your ratio expressed in a different way.
Q7. Old-age dependency ratio.
a. Explain how to calculate an old-age dependency ratio (you may want to refer to your notes, this is not the same as what was calculated above).
b. Find the old-age dependency ratio for your selected region.
c. Use the ratio in a sentence to explain its meaning.
d. Write a sentence explaining the meaning of the ratio with your ratio expressed in a different way.
Q8. Age-dependency ratio.
a. Explain how to calculate the dependency ratio (you may want to refer to your notes).
b. Find the age-dependency ratio for your selected region.
c. Use the ratio in a sentence to explain its meaning.
d. Write a sentence explaining the meaning of the ratio with your ratio expressed in a different way.
Q9. Analyze: Due to the baby boomers and extended life expectancy in the U.S., some say the age-dependency ratio should NOT include the 65-69-year-olds, because they are still in the workforce. Recalculate the age-dependency ratio using this new strategy. Compare your outcome to the age-dependency ratio found using the original strategy. Does the rate go up or down? Explain which is more "desirable"? What are some pros and cons associated with the two strategies? Please state your findings in complete and meaningful sentences.