Provide your answers in an excel file using a separate sheet for each problem.
Problem 1: Demand Forecasting
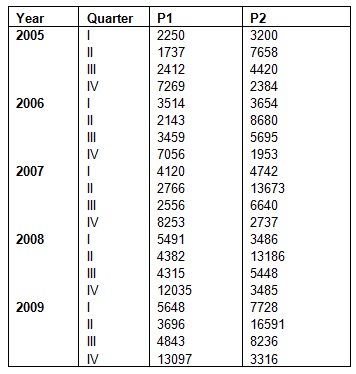
Company A produces products P1 and P2. Historically, demand for P1 peaks in the summer months, while demand for P2 peaks in the fall months. Based on historical trends, demand is expected to grow until 2012, after which it is expected to plateau. Using the historical data provided below, select the appropriate forecasting method and forecast the demand for the years 2010 to 2012.
Problem 2: Aggregate Planning
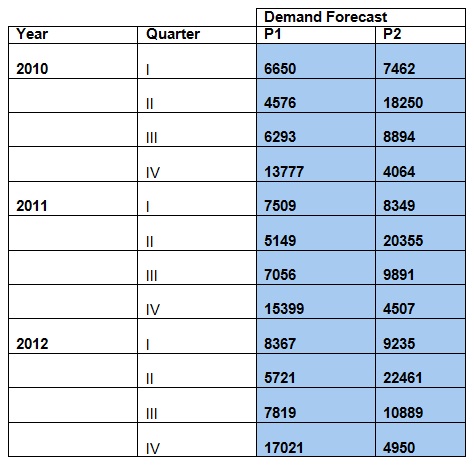
You are the facility production planning manager for Company A. Your problem is to determine a 3-year aggregate production plan (planning horizon is from Quarter I of 2010 to Quarter IV of 2012). The company produces two products, P1 and P2. Your team has provided to you a 3-year production plan.
Furthermore, it has gathered various data for the production, possible subcontracting options, labor costs, inventory handling costs, material costs and others. In particular, the production floor consists of 9 machines. Each machine can produce 4 items (either P1 or P2) per hour. The fixed cost for operating a machine is 200$ per quarter, and requires for its operation 4 workers. The material and variable production cost per unit is 20$. The initial starting inventory at the beginning of the planning horizon is 500, and the inventory holding cost is 2$ per unit at the end of each quarter. The marginal cost of stock out is 4$ per unit per quarter, and it is assumed that backlogged orders are fully fulfilled at the beginning of the next quarter. The hiring and training cost for each worker is 300$ and the layoff cost is 500$ per worker. Each worker cost 4$ per hour, and the current workforce is 20 (beginning of the first quarter of 2010) . On the other hand, the production facility operates 20 days per month, and the regular working hours are 8 hours per day. Finally, there is also available with no limitations a subcontracting option for the production that comes with a cost of 24$ per unit. The table below summarizes part of the above data.
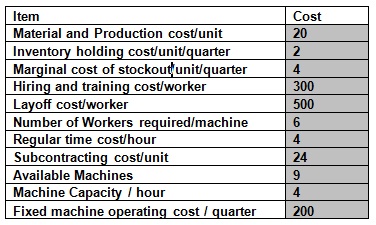
The goal of the aggregate planning is to determine the production and subcontracted quantities per quarter, the inventory held and Backlog/stockout quantities per quarter, the number of workers and the number machines used per quarter such that the overall cost is minimized and the available inventory at quarter IV of 2012 is 500 units.
Problem 3: DecisionTrees
Moon micro is a small manufacturer of servers that currently builds its entire production in Santa Clara, California. As the market for servers has grown dramatically, the Santa Clara plant has reached it capacity of 10,000 servers per year. Moon is considering 2 options to increase capacity. The first option is to add 10.000 units of capacity to the Santa Clara plant at a fixed annualized cost of $10,000,000 plus $500 labor per server. The second option is to have Molectron, an independent assembler, manufacture servers for Moon at a cost of $2000 for each server, excluding raw materials cost. Raw materials cost $8000 per server, and Moon sells each server for $15000.
The demand for Moon’s servers is has a 80% chance of increasing 50% and a 20% chance of remaining the same as the year before. Determine whether Moon should add capacity to its Santa Clara plant or it should outsource to Molectron.
Problem 4: Network Design
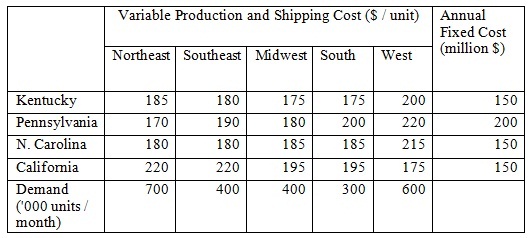
Blue Computers, a major PC manufacturer in the US, currently has plants in Kentucky and Pennsylvania. The Kentucky plant has a capacity of 1 million units per year, and the Pennsylvania plant has a capacity of 1.5 million units per year. The firm divides the US into 5 markets: Northeast, Southeast, Midwest, South and West. Each PC sells for $1000. The firm anticipates a 50% growth in demand (in each region) this year (after demand will stabilize) and wants to build a plant with a capacity of 1.5 million units per year to accommodate the growth. Potential sites being considered are in North Carolina and California. Currently the firm pays federal, state and local taxes on the income from the plant. Federal taxes are 20% of income, and all state and local taxes are 7% of income in each state. North Carolina has offered to reduce taxes for the next 3 years from 7% to 2%. Blue Computers would like to take the tax break in consideration when planning its network. Consider income over the next 3 years in your analysis. Assume that all costs remain unchanged over 3 years. Annual fixed costs, production and shipping costs per unit, and current regional demand (before the 50 percent growth) are shown below.
How should the network be structured setting as objective to maximize after tax profits?