Problem 1. Dale, Geraldine, Mon roe, and Grover can split their time between fishing and gathering coconuts. Their production possibilities are reflected by the joint PPF below.
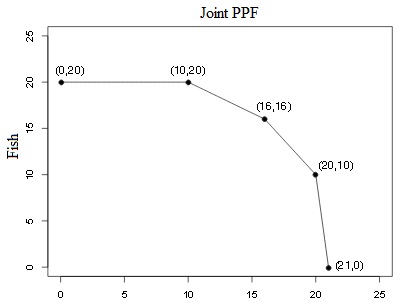
a) What is the opportunity cost of producing the first 5 coconuts?
b) What is the opportun ity cost of producing the first 2 fish?
c) If Geraldine has the second lowest opportunity cost of producing fish, what is her opportunity cost for gathering one coconut?
d) How many fish can Geraldine catch if she spends all of her time fishing?
Problem 2. Nowhereland is an island economy with population of 4 – Alice, Bob , Catherine and David. Everyday there are two survival activities under the northerly Sea of Ferocity: catching jellyfish and collecting seaweed. Both activities involve open water diving, requiring the use of an oxygen tank. Thus, a special kind of capital called “oxygen tank” is used in the production of these two goods. Each person possesses a different amount of oxygen tanks. The following table shows how many oxygen tanks each person has and how many are needed to produce each unit of the delicacies:
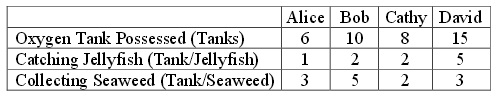
a) If everyone decides to catch jellyfish only, how many jellyfish can all of them produce ? If everyone decides to collect seaweed only, how many seaweed can all of them produce ?
b) What are the opportunity costs of catching jellyfish for each person? What are the opportunity costs of collecting seaweed for each person? Put your answers in the following table.
Opportunity Cost for a Jellyfish Opportunity Cost for a Seaweed
Alice
Bob
Cathy
David
c) Who has the absolute advantage in catching jellyfish or collecting seaweed? Who has the comparative advantage in catching jellyfish or collecting seaweed?
d) Determine the acceptable range of trading price for 1 jellyfish in terms of number of seaweed. Determine the accepta ble range of trading prices for 1 seaweed in terms of number of jellyfish.
e) Label Seaweed (S) and Jellyfish (J) on the x - axis and y - axis, respectively. Give the equations for the PPFs of each person and plot separately.
f) Draw the joint PPF for Nowhereland. Clearly mark and give the locations of the kink points. Write down the equation for each segment of the joint PPF
Problem 3. Use the demand and supply framework to qualitatively analyze the market in each of the scenarios given in a) through f). How would the demand and/or supply curves shift? (Leftward/rightward/no shift ) What are the effects on equilibrium price and quantity? (Increase/decrease/ambiguous) Summarize the result in the following table format:
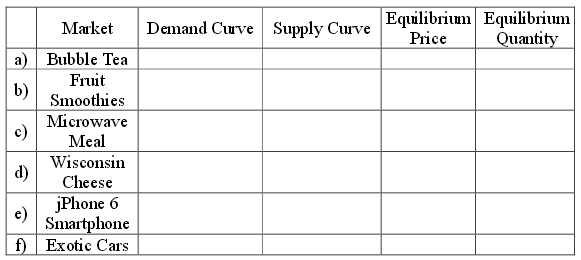
a) A recent study claims that the tapioca pearls in bubble tea are linked to increase risk for cancer, creating fear among consumers.
b) In addition to the study report in a), you are also told that fruit smoothies are good alternatives to bubble tea. At the same time, you know that the extended summer has invigorated fruit harvests.
c) Teaching assistants consider microwaveable meals an inferior good. This semester, they are greeted with bad news as the Department of Economics cuts their stipends by 15%.
d) Wisconsin produces fine cheese using cow's milk; however, mad cow disease has wiped out half the population of cows in Wisconsin.
e) Banana Inc. introduces the latest incarnation of its smartphone, the jPhone 6. A flood of consumers rush to order this famous smartphone. At the same time; however, the production line of Banana Inc. is plagued by riots, cutting production in half.
f) The economic slump and oil shocks have caused consumers to delay excessive spending, particularly, the purchase of exotic supercars. Automobile firms correctly anticipate the economic crisis and cut down pro duction of exotic models.
Problem 4. Consider the market for gasoline in Dane County, Wisconsin. Units of quantity and price are in Thousands of Gallons and $/gallon, respectively. Suppose t he gasoline demand is given by:
Qd = 2000 – 200P where Qd = Quantity Demanded and P = Price
We have the following information about the linear supply function:
• Market research shows that for an increase in price by $1/gallon, quantity supplied increases by 100 thousand gallons;
• In addition, when the price is $1/gallon, 900 thousand gallons of gasoline are supplied to Dane County.
a) Use the information to f ind the supply function, i.e., determine a and b in Qs = a + bP where Qs is Quantity Supplied and P is Price. (Hint: What is the equation of a line?)
b) Plot the demand and s upply curve with Quantity on x - axis and Price on y - axis. Clearly write the intercepts on both axes, and denote the area of consumer surplus and producer surplus.
c) Find the equilibrium price and quantity and the value of consumer and producer surplus. Suppo se there is a pipeline rupture in the Midwest, causing a gasoline shortage. Engineers have determined that pipeline capacity is reduced by 300 thousand gallons – meaning that, at every price level, there are 300 thousand fewer gallons of gasoline supplied to Dane County.
d) Which curve (demand or supply) is shifted? Which direction (leftward or rightward)?
e) Determine the equation (demand function or supply function) of the shifted curve.
f) Draw the demand and supply curve after the pipeline rupture, clearly compare the shifts.
g) Determine the equilibrium price and quantity and calculate the value of consumer and producer surplus after the pipeline rupture.
Problem 5. The market for coffee beans is described by the following equations: Qs = 2P – 8
Qd = 16 – P
a) Suppose the government sets a price ceiling at $10. Is there a shortage? Is there a surplus?
b) The government lowers the price ceiling to $5. Describe the changes in shortage/surplus.
c) Now suppose a price floor/ceiling has been instituted, which cause s a surplus of 9 units. Is this a floor or a ceiling? What specific price would create this surplus?
Problem 6. Consider a pumpkin market where the supply depends on the weather for the year. In bad - weather years, supply is P = 6 Qs + 2 In good - weather years, supply is P = 6 Qs – 58
The demand for pumpkins is Qd = 25 – 1/2 P.
Suppose that the government institutes a price support program to stabilize pumpkin prices at $32. The government promises farmers to buy or sell all that consumers desire or producers want to sell, at the pri ce of $32. Assume the government has enough storage capacity to buy all that farmers grow and enough in storage to supply all that consumers demand. Assume storage costs $1 per pumpkin.
a) How many pumpkins do consumers consume in good - weather years?
b) How many pumpkins do consumers consume in bad - weather years?
c) How much does the government spend in good - weather years?
d) How much does the government earn in bad - weather years? Now suppose that instead of a price support program, the government begins subsidizing pumpkins.
e) In bad - weather years, the government spends a total of $128 on the subsidy to pumpkin growers. What is the per - unit subsidy? What was the target price?
Problem 7. Suppose Latvia is a small, open economy that has a competitive steel market. The market supply curve is: Domestic supply: Qs = P/2 and the market demand in Latvia is: Domestic demand: Qd = 120 - P On the world market, steel sells for $30 a unit. Please note that graphs will be helpful in answering the following questions.
a) How much steel does Latvia import?
b) How much revenue will be raised by a tariff of $10 per unit of steel?
c) What is the deadweight loss associated with the tariff?
d) Suppose that instead of a tariff, Latvia creates a quota limiting the number of imports to only 15 units. How much steel will be consumed in Latvia? Try to draw the supply curve that consumers in Latvia will face.
Problem 8. This question walks you through the problem as a consultant for the taxation authority in Neverneverland. You st udy the follow ing information for the demand and supply functions for two goods – Beer and Cigarettes:
Beer Demand: P = 125 – 2Qd Unit of quantity: Thousands of Cans
Supply: P = 5 + 2Qs Unit of price: $/Can Cigarette Demand: P = 200 – 4Qd
Unit of quantity: Thousands of Packs Supply: P = 20 + Qs Unit of price: $/Pack
a) Plot the demand and supply curves in both markets. Denote the area of consumer surpluses and producer surpluses.
b) Look graphically at the demand curves for both markets. Which market has the lower pric e elasticity of demand, i.e., in which market are the consumers less sensitive to price change?
c) Find the equilibrium price and quantity in both markets.
d) Find the value of consumer surpluses and producer surpluses in both mark ets. Suppose you can choose only ONE of the two goods to apply an excise tax on the producer side of the particular market. Option 1 Appl y the excise tax of $10/Can to beer Option 2 Apply t he excise tax of $10/Pack to cigarette In analyzing the taxati on on each good and choosing the appropriate option in each case, you as a consultant must know the equilibrium traded price and quantity after taxation, the price that producers receive at the new equilibrium, tax revenue, consumer's tax incidence, producer's tax incidence and deadweight loss for both options.
e) Give the equations for the supply curves in both markets after the excise tax has been imposed.
f) Compute the consumer tax incidence (CTI) , the producer t ax incidence (PTI) , the tax revenue, and the deadweight loss (DWL) for each of option. Draw the appropriate demand and supply curves in both markets after the tax has been imposed, clearly denote the various areas (CTI, PTI, tax revenue, and DWL).
g) Motivated from the results in part f), is it true that producers can push the entire burden, namely, tax incidence , onto consumers?
h) Which option should the taxation authority choose if she wis hes to maximize her tax revenue?
i) Which option should the taxatio n authority choose if she wishes to minimize the consumer's burden?
j) Which option should the taxation authority choose if she wishes to mini mize the producer's burden?
k) Which option should the taxation authority choose if she wishes to minimize the deadweigh t loss?
l) Would the res ults you have analyzed in part e) - k ) hold if the excise tax is imposed on the consumer ’s side? (You are not required to re - compute all questions above; a simple set of graph s that can convince yourself is sufficed .)