Assignment:
Answer the following questions
1. A. Briefly define the following terms.
a. Tariff escalation
b. Optimal tariff rate
c. Voluntary export restraint (VER)
d. Terms of trade effect (of subsidy, of tariff)
e. Harmonized System (HS) of Commodity Classification
f. Common external tariff
g. Dumping
h. Quota Rent
i. Offshoring
j. Offshore outsourcing
k. Export subsidy
l. Production subsidy
m. Export tariff
n. Export quota
o. Trade creation
p. Trade diversion
1. B. Distinguish between the following terms
a. Prohibited subsidies vs. Actionable subsidies
b. Auction quota allocation vs. Rent-seeking quota allocation methods
c. Safeguard import duty vs. Anti-dumping duty
d. Anti-dumping duties vs. Countervailing duties
e. Trade creation vs. Trade diversion
f. Export subsidies vs. production or farm subsidies
g. Applied tariff rate vs. bound tariff rate
h. Regional trade agreement vs. Preferential trade agreement
i. Common market vs. customs union
j. World Trade Organization vs. GATT
k. Quota rent vs. tariff revenue
l. Rent seeking vs. VER
2. Answer the following questions as briefly and precisely as possible.
a. Why do most countries use trade protection or promotion tools like tariff, quota and subsidies?
b. Why do we need to make distinction between large and small countries in making trade policy analysis?
c. Is there any theoretical justification to use trade protection tools?
d. Explain why rich countries subsidize agricultural sector in their economies.
e. Explain why rich countries subsidize high-tech firms in their economies.
f. What are the causes of the trade war between the U.S. and China?
g. Which country benefits and which country loses from the trade war between the U.S and China?
h. What is the immediate impact of additional import tariff by the U.S. on Chinese products in the U.S. market?
i. Can a large country benefit from export tariff, export quota, and import tariff? If yes, explain the factor or reason that may contribute to the potential gain from these trade barrier tools.
j. Which countries (and groups within a country) most likely oppose international labor standards? Explain why.
k. Explain why some countries use voluntary export restraints (VER) instead of import quota or tariff?
l. List and explain at least three reasons why countries decide to form a regional trade agreement.
m. In most cases the overall net effects of a tariff and a quota in a country are similar. However, some countries prefer to use a tariff while others prefer a quota. Explain under what conditions a quota is preferable to a tariff.
n. Discuss four different ways of quota allocation methods in an importing country that imposed quota to limit import of a product.
3. Consider an agricultural subsidy provided by the US government. Consider also that milk is one of the products subsidized. If there is NO trade with the rest of the world, the domestic price of milk in the US would be $2.25 per gallon and the equilibrium quantity would be 100 gallons at this price. After trade opens, at the world market price of $1.50 per gallon, domestic firms supply only 50 gallons and consumers consume 130 gallons of milk. Hence, the country imports 80 gallons of milk at the world price. Now the government decides to subsidize the producers of milk. The government gives $1.50 for each gallon that the producers export. At this new price, the domestic consumers buy only 50 gallons, but the producers can produce 130 gallons.
a. Draw the demand and supply curves for milk in the US. Indicate both prices and quantities before and after subsidy.
b. Calculate or show the area that represents the gain to the producers after the subsidy.
c. Calculate or show the area that represents the costs to the government due to the subsidy.
d. Calculate or show the area that represents the change in consumer surplus after the subsidy.
e. Calculate or show the area that represents the dead weight loss due to the subsidy.
4. Refer to the figure below to answer the following questions. The small country in this example imposes a quota (Qd ) on clock imports. Sd represents domestic supply curve.
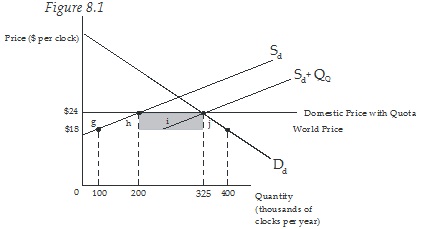
a. The size of the quota is _______ thousand clocks per year.
b. Calculate the gain in producer surplus as a result of the quota:
c. Calculate the loss in consumer surplus as a result of the quota:
d. What is the effect on the government tax revenue? Explain
e. If import quota licenses are auctioned off by the government, the dead weight loss to the importing country will be equal to the area:
f. If import quota licenses are allocated based on resource using screening procedure, calculate the net effect of the quota on the importing county.
g. If import quota licenses are allocated through fixed favoritism (to domestic firms), calculate the net effect of the quota on the importing country.
h. If instead of import quota license, the government agrees with a foreign supplier to limit the export amount (through voluntary export restraint), calculate the net effect of the quota on the importing country.
5. Refer to the figure below to answer the following questions. The country in this example is a large exporting country. Initially, the country exports motorbikes at the world price of $96. Motorbike producers lobby heavily and receive an export subsidy. After subsidy, the new world price becomes $90 per bike and domestic consumers purchase only 6 million motorbikes.
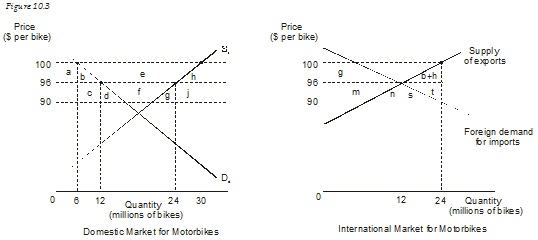
a. What is the size of the export subsidy? $_______
b. What is the domestic price per bike after subsidy? $ .
c. What is the change in export that results from the export subsidy? $_______
c. What is the cost of the export subsidy to the government? $_______
d. Which areas (in the domestic market panel) represent the loss due to the decline in international terms of trade? _______
e. What is the amount of the loss in world welfare resulting from the export subsidy? $_______
f. If this country were too small to affect world price, what would be the world price after subsidy? .
g. If this country were too small to affect world price, what would be the domestic price after subsidy? .
6. Refer to the figure below about a bike market in the UK to answer the following questions. The UK initially imposes a tariff of £250 per bike on all bike imports, as a result, the domestic market price of bike is £500. Then UK signed a free trade agreement with Austria.
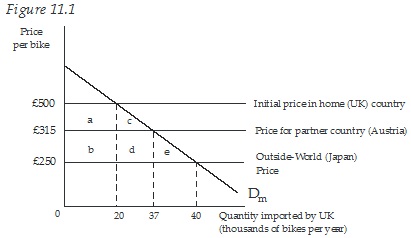
a. Before forming any trade union and when charging the tariff, UK will import from which country and how many units?
b. When trade opens (with no tariff), the UK would choose to import from _______ and consumer surplus would increase by £_______ thousand compare to the situation under tariff.
c. Now consider that UK forms free trade bloc with Austria, compared to situation under closed economy with tariff, trade creation is represented by area............. and trade diversion is represented by area............
d. As a result of the formation of trade bloc with Austria, the UK is better off/worse off (circle the correct answer) by £................ thousand.
e. If UK decides to form trade bloc with Japan, compared to the situation of closed economy with tariff, trade creation is represented by area ....................and trade diversion is represented by area...................
f. If the UK decides to form trade bloc with Japan, the UK is better off/worse off (circle the correct answer) by £................ thousand
7. Use the graphs below for a small country to answer the following questions. Note that Pw is the world price and t is the tariff rate that a country imposed on imports. The graph in panel (a) shows the effect of tariff immediately after the date of imposition; the graph in panel (b) shows the future effect (after 5 years of tariff) after removal of the tariff.
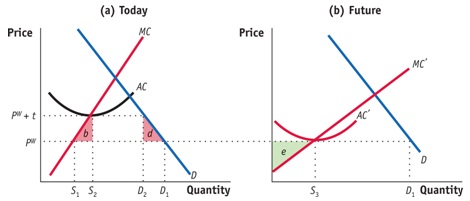
a. Indicate the amounts of domestic production and imports before the imposition of import tariff.
b. Indicate the amounts of domestic production and imports after the imposition of import tariff.
c. Indicate the amounts of imports and domestic production after the removal of import tariff 5 years after the date of the initial imposition.
d. Show the producer surplus created in 5 years as a result of the protection
e. Show the dead weight loss resulted from the import tariff for the five years the firm was protection by tariff.
f. What is the net effect on the country after five years of protecting this infant industry?
8. Consider a large country importing a good. The government of the country decides to impose import tariff equal to t. The exporting country firm decides to pay some of the tariff burden and transfer only some of it to the consumers in the importing. The two graphs show the effect of the import tariff in the home market and in the world market. Let Pw is the world price. In your answers use the letters as labeled on each graph.
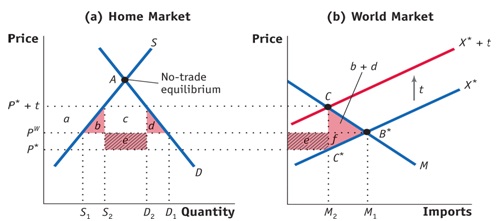
a. What is represented by P*?
b. What is the new world price?
c. What is the new domestic price
d. What is the effect on consumers in the home country?
e. What is the effect on producers in the home country?
f. What is the effect on the home country government?
g. What is the effect on the foreign exporters?
h. What is the dead weight loss in the home country?
i. What is the dead weight loss in the foreign country?
j. What is the dead weight loss in the world?
k. Why did the foreign exporters decide to absorb some of the burden of the import tariff?
9. A large country is offering export subsidy to its farmers to promote export. Let S represents export subsidy amount. The two graphs below show the effect of the export subsidy on the home country market and on the world market. Note that Pw stands for world price of the product and X is the export supply curve and X-S is the new supply curve after subsidy. In your answers use the letters as labeled on each graph.
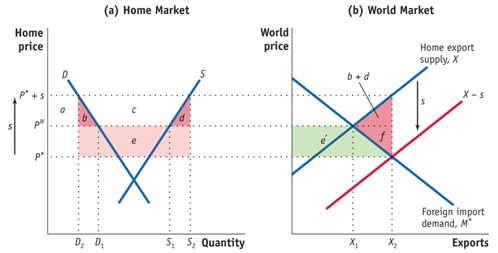
a. What is the price P* representing?
b. Why would the exporting firm charge a lower price in the world market?
c. What is the amount of export before subsidy?
d. What is the amount of domestic production before subsidy?
e. What is the amount of domestic production after subsidy?
f. What is the amount of export after subsidy?
g. What is the new world price for this product?
h. Calculate the effect on consumers in the home country?
i. Calculate the effect on producers in the home country?
j. Calculate the effect on foreign consumers?
k. Is there effect on foreign producers? Explain
l. Calculate the net effect of the export subsidy in the home country?
m. Calculate the net effect of the export subsidy in the foreign country?
n. Calculate the net effect of export subsidy in the world?
o. Why do countries provide export subsidy even if they know that there is a loss from export subsidy? Explain
10. A. Under what conditions would WTO allow countries to impose (practice) the following (be specific)?
1. Anti-dumping duties
2. Countervailing duties
3. Regional Trade Agreements
4. Subsidies
B. Describe the characteristics of each of the following trade blocs. Be certain to explain the ways in which they are the same and the ways in which they differ.
a. Economic union
b. Common market
c. Customs union
b. Free trade area
C. Offshoring and offshoring outsourcing
a. Why do companies offshore some of their activities?
b. Is offshoring different from traditional trade in goods and services? Explain
c. Is offshoring or offshore outsourcing good for a home country? Explain
11. Consider the following variation of Table 11-1 for the U.S. semiconductor market
|
|
U.S. Tariff rates
|
|
|
0%
|
8%
|
16%
|
|
From Canada, before NAFTA
|
$45
|
$W
|
$52.2
|
|
From Asia, before NAFTA
|
$40
|
$X
|
$Y
|
|
From Canada, after NAFTA
|
$43
|
$Z
|
$Z
|
|
From Asia, after NAFTA
|
$40
|
$X
|
$Y
|
|
From the United States
|
$46
|
$46
|
$46
|
a. Fill in the values for W, X, Y, and Z.
b. Suppose that before NAFTA, the United States had a 16% tariff on imported semiconductors. Which country supplied the U.S. market? Is it the lowest-cost producer?
c. After NAFTA, who supplies the U.S. market? Has either trade creation or diversion occurred because of NAFTA? Explain.
d. Now suppose that before NAFTA, the United States had an 8% tariff on imported semiconductors. Then repeat parts (b) and (c).
e. In addition to the assumptions made in (d), consider the effect of an increase in high-technology investment in Canada due to NAFTA, allowing Canadian firms to develop better technology. As a result, three years after the initiation of NAFTA, Canadian firms can begin to sell their products to the United States for $40. What happens to the U.S. trade pattern three years after NAFTA? Has either trade creation or diversion occurred because of NAFTA? Explain.
12. Answer the following questions briefly
a. To improve national welfare, a large country would do better to implement an export subsidy rather than an import tariff. Is this true or false? Explain why.
b. Who gains and who loses when governments in Europe and the United States provide subsidies to Airbus and Boeing, respectively?
c. Provide reasons for countries to use export subsidies. Does your answer depend on whether firms compete under perfect or imperfect competition?
Please bring all your questions to class. You can also come to my office to ask questions or email me if you need clarifications on some of the questions.
Readings:
International Trade
By Robert C. Feenstra and Alan M. Taylor