Assignment:
1. Describe the three types of big data analytics and how they would be used in a company you work for? In your answer, give a representative example/application of each type of analytics. Briefly explain how they would each contribute to the overall goal of improving decision making.
2. The mean test score on an ANLY500 exam was 75 (out of 100). Would the median be expected to be above, below, or around the same value of 75? In one or two sentences, explain why.
3. Explain the following statement as you would explain it to someone who knows very little about statistics. Be sure to explain the underlined terms.
The standard error of the mean is the standard deviation of the sampling distribution of the sample mean. A larger sample size produces a smaller standard error of the mean, and reduces the probability of a Type II error in a z test.
4. A company makes 4K monitors and does not like to have defective pixels. Historically, the mean number of defective pixels in a TV is 20. An engineer is hired to make better monitors that have fewer defective pixels. After her first week of work she claims that she can significantly improve the current method. To check her claim you try her new method on 100 new monitors. The average number of defective pixels in those 100 monitors is 19.1. Assume that the new method doesn't change the standard deviation of defective pixels, which has always been 4.
(a) Test if the new method is significantly better than the old one at the α = 0.05 level.
(b) Using the new method, assume that the mean number of defective pixels is actually19. What is the chance that your test from part 1 will conclude that the new method is statistically more effective?
(c) How many monitors will you have to check so that the test you did in part A will conclude that the new method is effective, with 95% probability? Please assume again that the mean number of defective pixels is actually 19.
5. Two methods of memorizing words are to be compared. You choose two groups of 5 people, where the first person in the first group has the same characteristics as the first person in the second group (they have the same educational level, age, etc.). Same thing about the second person in each group - they are also similar to each other in terms of education, age, etc. Same thing for the third, fourth and fifth people from each group. The first group is assigned to the first method of memorization and the second group to the other method. The number of words recalled in a memory test after a week's training with these two methods is shown below.
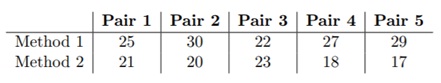
(a) Name the test you would perform
(b) State your hypotheses
(c) Set up and perform the calculation for any test statistic you may use.
(d) State your conclusion
6. After your graduation you decide to go to Monte Carlo for vacation. You visit a casino and decide to gamble; specifically, you want to play roulette. Before you start betting, you watch 500 roulette games at the casino, and you find that red is hit 260 times. Can you determine whether the roulette is fair? In case you don't know how roulette is played in Monte Carlo, it involves spinning a wheel that
has many slots around it. There is 1 gold slot, 18 red slots, and 18 black slots.
(a) Set up the hypotheses.
(b) Calculate the P-value. Can you reject null hypothesis at the 0.05 level?
(c) Find a 95% CI for the proportion of red results.
7. Which of the following statements is / are true: (select ONE single option). If statements are false, explain why and correct them to make them true.
A) A result is called "statistically significant" whenever the alternative hypothesis is true.
B) The confidence level for a confidence interval for a mean is the probability that individuals in the population have values that fall into the interval.
C) Null and alternative hypotheses are statements sometimes about sample statistics and sometimes about population parameters
D) In hypothesis testing, a Type 2 error occurs when null hypothesis is rejected when the null hypothesis is true.
E) Standard error increases as sample size increases.
F) A and C only
G) A, C and D only
H) B and C only
I) B and D only
J) A, B, and D only
K) All of the above
L) None of the above
8. A certain factory consumes on average 1000 m3 of water per day. A random sample of 100 days was taken to test if the mean daily water intake remains 1000 m3 against the alternative that the mean water consumption has increased. We know that the sample mean equals x ¯ = 1005 m3 and the sample quasi-variance is s2 = 400 m6.
(a) Define the null and alternative hypotheses for this test.
(b) Perform the test at the significance level α = 0.05.
(c) What is the smallest value of α for which the null hypothesis can be rejected?
(d) Calculate the power of the test in two scenarios: If the true mean water consumption equals µ1 = 1000 m3 and µ1 = 1008 m3.
(e) Indicate which of the following statements are true/false and justify your answer:
If we reject the hypothesis at the level α = 0.05, we can also reject H0 at the level α = 0.1.
The Type 1 error is the probability to reject the null hypothesis when H1 is true.
iii. If the p-value equals 0.15, we can reject the null hypothesis at the level 10%.
9. To study the impact of the crisis on different cultural sectors, you have collected information on the number of performances from several artists during the years 2007 (240 artists) and 2012 (191 artists). The following table indicates the mean, standard deviation and number of observations for each of the two years:
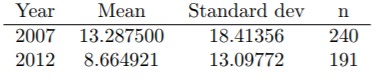
(a) Indicate the null and alternative hypotheses, and compute the value of the test statistic.
(b) Complete the hypothesis test at a significance level of 5%
If we study the evolution of the variance, we obtain the following results corresponding to the comparison of the variances in the numbers of performances for the years 2007 and 2012:
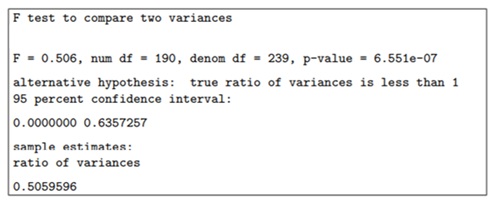
(c) Indicate the null and alternative hypotheses, and compute the value of the test statistic.
(d) Complete the hypothesis test at a significance level of 5%.
10. Which of the following cannot be determined from a regression equation?
A) Estimate whether the linear association is positive or negative
B) Estimate whether the association is linear or non-linear
C) Estimate the slope between y and x
D) Predict the value of y at a particular value of x
E) All of the above
F) None of the above
11. Select the single choice for the relationship for which a regression analysis may be used
A) Relationship between gender and whether person has a tattoo
B) Relationship between political party membership and opinion about abortion
C) Relationship between height and weight
D) Relationship between eye color (blue, brown, etc.) and hair color (blond, etc.).
E) None of the above
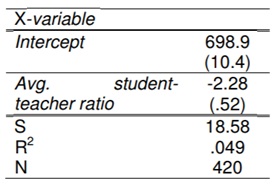
12. It is often suggested that smaller class sizes will enable public elementary schools to improve the quality of the education they offer their pupils. Hiring the additional teachers that this would require would naturally cost money, so it is important to know if reducing class sizes has any effect on basic measures of educational quality like scores on standardized tests. Consider data gathered in 1998 on student-teacher ratios and test scores from 420 California school districts.
In particular, the dependent variable is the average score on a standardized reading and math test administered to fifth-graders in a particular school district while the independent variable is of course the average student-teacher ratio for elementary school classes in that district. The regression estimates are given in the following table. Following tradition, standard errors appear below the corresponding point estimates in parentheses. The regression standard error (S), coefficient of determination (R2 )and sample size (n) are also included in the table. In what follows, feel free to pretend that the average test scores and student-teacher ratios are normally distributed.
Table: Regression of average test scores on average student-teacher ratios
(a) How many degrees of freedom are associated with this regression? Provide both analysis and single number.
(b) Construct a 95% confidence interval for the slope parameter. Provide both analysis and values.
(c) Test the hypothesis that there exists no linear relationship between average class sizes and average test scores. Conduct your test and report an approximate p value for your test. Provide analysis in 1 to 2 sentences.
(d) Interpret the point estimate of the slope parameter and the result of the test conducted in part (c) of this question. Is a reduction in class sizes related to an improvement in test scores?
Provide analysis in 1 to 2 sentences.
13. Which of the following is not correct concerning choosing the appropriate size of the smoothing constant (a) in the simple exponential smoothing model?
A) Select a value that minimizes RMSE.
B) Select values close to zero if the series has a great deal of random variation.
C) Select a value that maximizes mean-squared error.
D) Select values close to one if you wish the forecast values to depend strongly on recent changes in the actual values.
E) All the above are correct.
14. Seasonal indices of sales for the Northern Lights Resort are for January 1.20; and December .80. If December sales for 1998 were $6,000, a reasonable estimate of sales for January 1999 is:
A) $6,000
B) $7,500
C) $4,800
D) $10,000
E) None of the above are correct
15. The data below is given for partial demand and forecast data for a product:
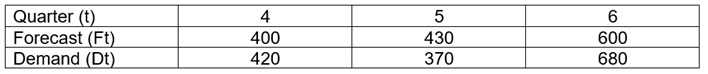
The questions are as follows:
(a) Compute a 3-quarter simple moving average for quarter 7.
(b) The actual demand for quarter 7 turned out to be 1060. Compute an exponentially smoothed forecast for quarter 8 with α (alpha) = 0.15. Use the forecast for quarter 7 from part (a)
(c) Observing the actual demands for quarters 4 through 7, you are thinking about updating the value of α in part (b). Would you choose a smaller or larger value than 0.15? Justify your answer briefly.
(d) For the forecasts given in part A) (quarters 4 to 6) and the forecast computed in A) (quarter 7), compute a measure of bias error. Is there any bias, and if so, has the forecast been biased low or high?
(e) The product turns out to be popular homemade-style ice cream made in a small plant. The complete demand data for years 1, 2, and 3 are given below.
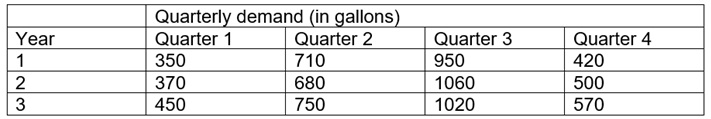
Compute the forecast for each of quarters in year 4, given that the forecast for the total demand in year 4 is 2980 gallons.
16. Mark the following statements as being True or False. If False, correct the statement to be true.
(a) The main difficulty with assessing missing data is to determine why it is missing, whether it is due to omission, inability to find or enter a value, or if a null value represents something tangible.
(b) Hierarchical clustering methods require a predefined number of cluster, similar to k-means clustering.
(c) One way to assess reliability and validity of clustering is to use different methods of clustering and compare the results.
(d) Cluster analysis is a technique for analyzing data when the criterion or dependent variable is categorical, and the independent variables are interval in nature
(e) Discriminant functions are linear combinations of the predictor or independent variables, which will best discriminate between categories of the criterion or dependent variable groups.
17) Data mining methodologies include which of the following:
A) Mining knowledge in multidimensional space
B) Handling uncertainty, noise or incompleteness of data
C) Pattern evaluation and patter or constraint-guided mining
D) Mining various and new kinds of knowledge
E) All of the above (A, B, C, and D)
F) C and D only
G) None of the above
18) The most important part of ______ is choosing variables on which clustering is based
A)Interpreting and profiling clusters
B)Selecting a clustering procedure
C)Assessing the validity of clustering
D)Formulating the clustering problem
19) Which of the following are not true about clustering?
A)The complete method of linkage clustering uses information on all pairs, not just the minimum or maximum distances
B)Agglomerative clustering is a clustering procedure where all objects start out as one giant cluster. Clusters are formed by dividing this cluster into smaller and smaller clusters.
C)Hierarchical clustering is a clustering procedure characterized by the development of a tree-like structure called a dendrogram.
D)A and C only
E)B and C only
F) A and B only
G) All of the above
H)None of the above
20) Data that is used to optimize the parameter settings of a classification model is the ______ data set.
A)training
B) test
C)validation
D)verification
21) Discriminant analysis can be used to answer which of the following questions:
A)In terms of demographics, how do customers who exhibit store loyalty differ from those who do not?
B)How much of a variation in sales can be explained by advertising expenditures, prices, and level of distribution?
C)What are the distinguishing characteristics of consumers who respond to direct mail solicitations?
D)B and C
E) A and C
F)A and B
G) All of the above (A, B and C)
H) None of the above
22) Steve Showme was able to collect relatively clean sample records from the most recent census. He is interested in predicting whether a person made over $75,000 a year. Here the two features are modeled with two Boolean variables X1,X2 ∈ {0,1} and label Y1 ∈ {0,1}, where Y = 1 indicates that a person makes over $75,000 a year. The figure below shows three positive samples ("+" for Y = 1) and one negative sample ("-" for Y = 0).
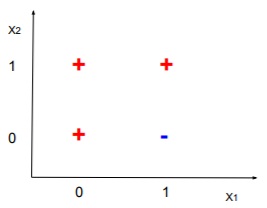
Answer these two questions based on the above scenario and figure
(a) If a KNN classifier (K = 1) is trained based on the data in the figure above, and then subsequently classified, which of the above sample(s) must be misclassified by this classifier?
A) The sample at (0,0)
B) The sample at (1,0)
C) The sample at (0,1)
D) The sample at (1,1)
E) A, B and D
F) all of the above
G) none of the above
(b) This is a two part question
i) Is there a logistic regression classifier using X1 and X2 that can perfectly classify the examples inthe above figure? Please explain.
ii) Is there a logistic regression classifier using X1 and X2 that can perfectly classify the example above if the label at point (0,1) is changed from "+" to "-"? Please explain.
23) Company XYZ wants to maximize the profit for two products A and B which are sold at $ 25 and $ 20 respectively. There are 1800 resource units available every day and product A requires 20 units while B requires 12 units. Both of these products require a production time of 4 minutes and total available working hours are 8 in a day. What should be the production quantity for each of the
products to maximize profits.
(a) Write the objective function for this problem.
(b)What are the decision variables in this problem?
(c) What are the constraints (resource and time) in this problem?
(d) Fill in the blank. Find optimal values for units of Product A and B to obtain the maximum sales within the given constraints.
You may use any method (R, Excel, anything else) to solve this problem; you do not have to show any code, however please show any equations/formulas you use or derive to support your thought process.
Company XYZ should produce __________ units of Product A, and ___________ units of Product B to get sales of ___________ dollars, which is the maximum sales the company can receive given the constraints.
24) Red Dwarf Toasters needs to produce 1000 of their new "Talking Toaster". There are three ways this toaster can be produced: manually, semi-automatically, and robotically. Manual assembly requires 1 minute of skilled labor, 40 minutes of unskilled labor, and 3 minutes of assembly room time. The corresponding values for semiautomatic assembly are 4, 30, and 2; while those for robotic assembly are 8, 20, and 4. There are 4500 minutes of skilled labor, 36,000 minutes of unskilled labor, and 2700 minutes of assembly room time available for this product. The total cost for producing manually is $7/toaster; semi-automatically is $8/toaster; and robotically is $8.50/toaster.
(a) Formulate the problem of producing 1000 toasters at minimum cost meeting the resource requirements. Clearly define your variables, objective and constraints.
(b) The union contract states that the amount of skilled labor time used is at least 10% ofthe total labor (unskilled plus skilled) time used. Update your formulation in (a) to handle this requirement.
(c) Any unused assembly floor time can be rented out at a profit of $0.50/minute. Update your formulation to include this possibility.