Assignment:
Written Answers (Make sure all of your answers are complete. If you do not have sufficient room for your answer, add lines as needed):
Any other sources must be approved by me before use. All answers will be checked for plagiarism. The answers should be written in your own words.
1. Explain the difference between quantitative and qualitative data and the purpose of each.
2. Provide the steps in the scientific method and give an example of potential bias and how to avoid that bias for each step.
3. Define reproducibility in science and explain how experimental design affects reproducibility.
4. Explain the difference between correlation and causation and give an example of when they are linked and an example of when they are not linked.
5. Write a null hypothesis and alternate hypothesis for the following question:
Does the amount of protein X in yeast change when gene Y is deleted?
6. What kind of t-test would be needed to perform statistics using your hypotheses?
7. What would it mean if the p-value was set at 0.10 for this experiment?
8. Before you can determine whether protein X changes, you need to confirm that the gene Y is deleted by doing a PCR amplification and running a gel to compare the size of the wild-type (normal) gene region to the deleted gene region. Describe the steps to PCR amplify the region around gene Y including the reagents needed, function of each reagent, and purpose of each step.
9. What kind of experiment could be used to measure whether protein X changed? Explain the steps needed for this experiment including the reagents needed, function of each reagent, and purpose of each step.
10. When determining the amount of protein X, what is the importance of signal-to-noise ratio?
11. Before determining the amount of protein X in each sample, you need a standard curve of varying known amounts of protein X related to signal. Using the data below, calculate a standard curve giving the equation and r2-value for the standard curve (this can be done in Excel or other graphing program).
|
Amount
|
Signal
|
|
10
|
30
|
|
100
|
513
|
|
1000
|
5501
|
|
5000
|
23258
|
|
10000
|
43636
|
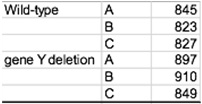
12. At the end of this exam is the data for the class.For questions 12, 13, and 14; only use the data next to your name as "your data".Use the standard curve you found in question 11 to calculate the amount of protein X for each of your samples. Show your work either by hand or with Excel equations listed.
13. Calculate the Mean and Median for your wild-type, and the Mean and Median for your gene Y deletion. Show your work either by hand or with Excel equations listed.
14. Using the critical t-value table from lecture, perform the correct t-test on your data andstate whether your data is statistically significant.Show all of your work either by hand or with Excel equations listed.
15. What precautions should be taken to store your data & what data would be submitted for a paper?