Outline: This practical assignment is designed to put in practice the theories and techniques delivered and practiced in class. In a group of 2, the students are required to:
1. identify the types of variables
2. measure the central tendency of data
3. construct contingency tables
4. calculate probability and observe the relationship between variables
5. define the distribution of the variables
Part 1:
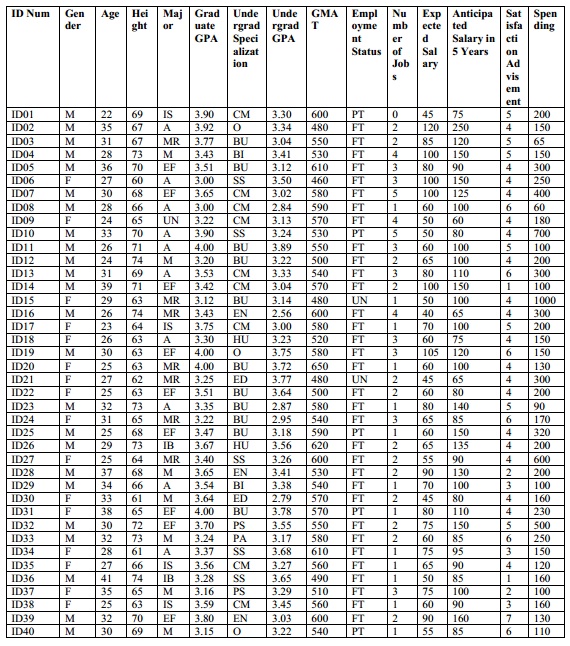
1. Which variables in the survey are categorical, numerical (discrete or continuous)?
2. How or in what format should categorical and numerical data be respectively organised and presented? (hint: please illustrate the presentation of data)
Part 2:
1. Compute the mean, median, first quartile, third quartile, range, inter-quartile range for "Age".
2. Construct a box plot and determine whether the data is skewed, if so, how?
Part 3:
1. Construct a contingency table for
a. gender and graduate major,
b. gender and undergraduate major,
c. gender and employment status,
d. graduate major and undergraduate major and
e. graduate major and employment status
2. For the "gender and employment status" contingency table:
a. please compute all the conditional and marginal probabilities
b. what conclusions can you reach about whether these variables are independent?
Part 4:
1. For each numerical variable, decide whether the data approximates the normal distribution by comparing data characteristics to theoretical properties.