Problems:
Curve Fitting and Input and Output Files
This is a three dimensional version of the two dimensional curve fitting problem associated with determining thevertical alignment of a road. In this case, the problem is that groundwater hydrologists want to map thepiezometric surface (top of the water table) in a region so they can assess the potential for development of a groundwater source for drinking water for a nearby city. A set of wells has been drilled and the elevation of thewater table has been measured at each of these wells. The problem is to fit a nonlinear surface to theseobservations that can then be used to predict the elevation of the groundwater table at other points in the region.
For purposes of this problem, assume that the water table is stable and not changing with time.
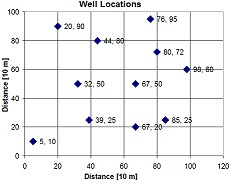
The region has been laid out on a rectilinear grid. The locations of the wells are shown here:
The observed elevation of the water table at each of the wells is provided in this table:
Well Name X-Distance
[10 m]
Y-Distance
[10 m]
Water Table Elevation
[m]
W1 5 10 68
W2 20 90 74
W3 32 50 71
W4 39 25 75
W5 44 80 72
W6 67 20 93
W7 76 95 80
W8 80 72 87
W9 85 25 101
W10 98 60 103
W11 67 50 85
Your job is to find the six parameters (a, b, c, d, e, f) of this equation to fit observed data best:
Z = a*X + b*X2 + c*X*Y + d*Y + e*Y2 + f
Z represents the predicted elevation of the water table. The parameters may be positive or negative.
1. Define any notation that you use.
2. Formulate a linear optimization model to determine the optimal values of the parameters. Assume that the objective is to minimize the maximum difference between the model predicted water table elevations and the observed elevations. Provide a one sentence description of each constraint/bound; or ensure that your spreadsheet model is sufficiently documented that it is clear what you are attempting to do.
3. Solve the optimization model.
4. Produce a three dimensional chart showing the predicted water table surface.
5. Write a short report-no more than one page, double spaced, font size 12, one inch margins-to the mayor of the city describing what you have done in non-technical terms, and describing the predicted water table surface.
6. Provide a copy of any input and output files.
(Hint: Consider a variable MAXDIF. Suppose MAXDIF is required to be greater than or equal to the absolute value of the difference between the model predicted and observed elevations at well 1. Suppose MAXDIF is also required to be greater than or equal to the absolute value of the difference between the model predicted and observed elevations at well 2. The same restrictions exist at wells 3, 4, 5, .... In this case, the value of MAXDIF is greater than or equal to the greatest absolute value difference. If the objective is to minimize MAXDIF, the result will be the smallest absolute difference in elevations at any of the wells.)