Assignment Task: Attempt all questions. A calculator may be used. Show intermediate steps in calculation.
Question 1: Figure Q1 illustrates a typical Combined Heat and Power (CHP) system.
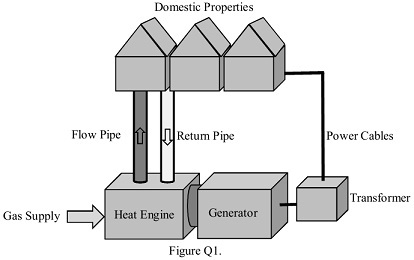
In normal operation the Heat Engine and Generator provide heat and electricity to domestic properties. The Heat Engine uses the Gas Supply to generate heated water for the properties via the Flow Pipe. Once the heat has been used by the consumers, the cooled water comes back to the Heat Engine via the Return Pipe. At the same time the Heat Engine powers the Generator, which in turn produces the electricity supply for the Domestic Properties. Then the Transformer distributes the electricity to the Domestic Properties via the Power Cables. Note that the CHP fails to operate if the cooled water does not return from the Domestic Properties.
(a) Construct an event tree diagram based on the description of the CHP system in Figure Q1 when there is an increase in demand for heat and electricity from the Domestic Properties.
(b) Hence or otherwise, given the fault probability of the components shown in Table Q1, calculate the reliability of the CHP system for supplying heat and electricity.
(c) By considering the main failure modes for the CHP system, construct an appropriate FMEA for this system using the values given in Table Q1. Use the resulting RPN to determine the most critical component in the system.
Table Q1.
|
Components
|
Probability of fault (P)
|
Severity (SEV)
|
Occurrence (OCC)
|
Detection (DET)
|
|
Gas Supply
|
1 x 10⁻³
|
8
|
2
|
1
|
|
Heat Engine
|
2 x 10⁻³
|
8
|
5
|
3
|
|
Generator
|
5 x 10⁻⁴
|
6
|
6
|
2
|
|
Flow Pipe
|
2 x 10⁻⁴
|
5
|
1
|
7
|
|
Return Pipe
|
1 x 10⁻⁴
|
4
|
1
|
7
|
|
Transformer
|
8 x 10⁻⁴
|
6
|
6
|
2
|
|
Power Cables
|
3 x 10⁻⁴
|
5
|
6
|
3
|
Question 2: Figure Q2 represents a wheel drive assembly for an electric car.
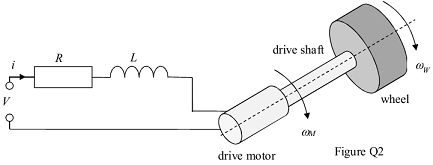
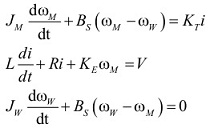
The assembly is made up of a dc drive motor connected to a wheel by means of a drive shaft. The drive motor has resistance R (Ω), inductance L(H), a input voltage V(V), current i(A), moment of inertia JM(kgm2), torque constant KT(Nm/A) and back emf constant KE(V/(rad/s)). This motor rotates with a rotational speed of ωM (rad/s), which in turn rotates the wheel via the drive shaft. The drive shaft has a viscous damping coefficient BS(Nm/(rad/s)) and the wheel rotates with a rotational speed of ωW(rad/s). The wheel has moment of inertia JW(kgm2). The system can be described by the following differential equations:
(a) With respect to the description given above, show how the following faults would manifest themselves in the motor drive system:
(i) Additive faults.
(ii) Parameter faults.
(b) By taking the Laplace transform of these differential equations, derive the residual generation matrix for the system described above.
(c) Hence or otherwise, derive the structured residuals for this system.
(d) By considering the structured residuals for this motor system, construct a fault signature table for the additive and multiplicative faults that could affect this system. Use a signature relationship that indicates the polarity of the residual.
Question 3: Figure Q3(a) represents a robot position control system.
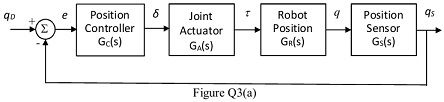
This closed loop system contains sensors for measuring the position of the robot and the actuators move a particular joint in the robot. From the diagram, the difference between the reference attitude, qD, and the measured attitude, qS, is an error signal, e. The position controller uses this error to generate the input command for the actuator, δ. The actuator then produces a torque, τ, which changes the position of the robot, q. This is measured by the position sensor, which produces the measured position that is fed back to the controller. The controller, actuator, robot and sensor are represented by transfer function GC(s), GA(s), GR(s) and GS(s) respectively.
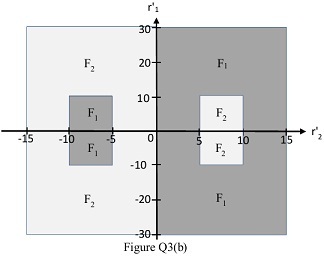
Figure Q3(b) represents the symptom-fault relationship between the output error residuals (r'1 and r'2) and, particular faults in the inputs (F1) and particular faults in the outputs (F2). Input fault regions are shades light grey and output faults are shaded in dark grey.
(a) Show how faults F1 and F2 can be represented in the system diagram shown in Figure Q3(a).
(b) Hence or otherwise, derive the associated output error residual expression involving faults F1 and F2 in this closed loop system for the following scenarios.
(i) When the process and the model are different.
(ii) When the process and the model are identical.
In both cases assume there is no noise in the system.
(c) Using the symptom-fault relationship illustrated in Figure Q3(b), construct a decision tree that shows how the residual errors are connected to the faults F1 and F2.
(d) Describe how the following recovery scenarios could be implemented in this system:
(i) Hot Standby Dynamic Redundancy for the joint actuator.
(ii) Output Observation Reconfiguration for the position sensor.
Illustrate your answers with appropriate diagrams.
All our professional Fault Detection, Isolation and Recovery Assignment Help tutors always write the paper from the scratch after doing the comprehensive research, so that, you will always get the most authentic, faultless and plagiarism free assignment paper every time!!
Tags: Fault Detection, Isolation and Recovery Assignment Help; Fault Detection, Isolation and Recovery Homework Help; Fault Detection, Isolation and Recovery Coursework; Fault Detection, Isolation and Recovery Solved Assignments; Combined Heat and Power system Assignment Help; Combined Heat and Power system Homework Help