Discuss the below:
Shopping Survey
The major shopping areas in the community of Springdale include Springdale Mall, West Mall, and the downtown area on Main Street. A telephone survey has been conducted to identify strengths and weaknesses of these areas and to find out how they fit into the shopping activities of local residents. The 150 respondents were also asked to provide information about themselves and their shopping habits. The data and the survey variables can be found in the attached files. Please address each of the following:
- Construct three different frequency distributions, one each for variables 7, 8, and 9. How do the three areas compare in terms of residents' general attitudes toward each?
- Do people tend to spend differently at the three areas? Construct and compare frequency distributions for variables 4, 5, and 6.
- To find out more about specific strengths and weaknesses of the areas, set up a frequency distribution for variable 10 (e.g., how many "best-fits" votes did each area get for "easy to return/exchange goods"?). Repeat this for variables 11-17 and interpret the results. Which of the malls seems to be the "bargain mall"? Which area seems to have the most convenient shopping hours?
- To find out more about the shoppers in the areas, set up a frequency distribution table to find out the number of male and female shoppers (Variable 26); the number of years each shopper has for education completed (Variable 27); and the marital status (Variable 28). Then find the average number of people in the house as well as the average age of the shopper interviewed. Interpret the results.
A. How Often Respondent Shops at Each Area (Variables 1-3)
|
|
1. Springdale Mall
|
2. Downtown
|
3. West Mall
|
|
6 or more times/wk.
|
(1)
|
(1)
|
(1)
|
|
4-5 times/wk.
|
(2)
|
(2)
|
(2)
|
|
2-3 times/wk.
|
(3)
|
(3)
|
(3)
|
|
1 time/wk.
|
(4)
|
(4)
|
(4)
|
|
2-4 times/mo.
|
(5)
|
(5)
|
(5)
|
|
0-1 times/mo.
|
(6)
|
(6)
|
(6)
|
B. How Much the Respondent Spends during a Trip to Each Area (Variables 4-6)
|
|
4. Springdale Mall
|
5. Downtown
|
6. West Mall
|
|
$200 or more
|
(1)
|
(1)
|
(1)
|
|
$150-under $200
|
(2)
|
(2)
|
(2)
|
|
$100-under $150
|
(3)
|
(3)
|
(3)
|
|
$ 50-under $100
|
(4)
|
(4)
|
(4)
|
|
$ 25-under $50
|
(5)
|
(5)
|
(5)
|
|
$ 15-under $25
|
(6)
|
(6)
|
(6)
|
|
less than $15
|
(7)
|
(7)
|
(7)
|
C. General Attitude toward Each Shopping Area (Variables 7-9)
|
|
7. Springdale Mall
|
8. Downtown
|
9. West Mall
|
|
Like very much
|
(5)
|
(5)
|
(5)
|
|
Like
|
(4)
|
(4)
|
(4)
|
|
Neutral
|
(3)
|
(3)
|
(3)
|
|
Dislike
|
(2)
|
(2)
|
(2)
|
|
Dislike very much
|
(1)
|
(1)
|
(1)
|
D. Which Shopping Area Best Fits Each Description (Variables 10-17)
|
|
Springdale
Mall
|
Downtown
|
West
Mall
|
No
Opinion
|
|
10. Easy to return/exchange goods
|
(1)
|
(2)
|
(3)
|
(4)
|
|
11. High quality of goods
|
(1)
|
(2)
|
(3)
|
(4)
|
|
12. Low prices
|
(1)
|
(2)
|
(3)
|
(4)
|
|
13. Good variety of sizes/styles
|
(1)
|
(2)
|
(3)
|
(4)
|
|
14. Sales staff helpful/friendly
|
(1)
|
(2)
|
(3)
|
(4)
|
|
15. Convenient shopping hours
|
(1)
|
(2)
|
(3)
|
(4)
|
|
16. Clean stores and surroundings
|
(1)
|
(2)
|
(3)
|
(4)
|
|
17. A lot of bargain sales
|
(1)
|
(2)
|
(3)
|
(4)
|
E. Importance of Each Item in Respondent's Choice of a Shopping Area (Variables 18-25)
|
18. Easy to return/exchange goods
|
(1)
|
(2)
|
(3)
|
(4)
|
(5)
|
(6)
|
(7)
|
|
19. High quality of goods
|
(1)
|
(2)
|
(3)
|
(4)
|
(5)
|
(6)
|
(7)
|
|
20. Low prices
|
(1)
|
(2)
|
(3)
|
(4)
|
(5)
|
(6)
|
(7)
|
|
21. Good variety of sizes/styles
|
(1)
|
(2)
|
(3)
|
(4)
|
(5)
|
(6)
|
(7)
|
|
22. Sales staff helpful/friendly
|
(1)
|
(2)
|
(3)
|
(4)
|
(5)
|
(6)
|
(7)
|
|
23. Convenient shopping hours
|
(1)
|
(2)
|
(3)
|
(4)
|
(5)
|
(6)
|
(7)
|
|
24. Clean stores and surroundings
|
(1)
|
(2)
|
(3)
|
(4)
|
(5)
|
(6)
|
(7)
|
|
25. A lot of bargain sales
|
(1)
|
(2)
|
(3)
|
(4)
|
(5)
|
(6)
|
(7)
|
|
|
|
|
F. Information about the Respondent (Variables 26-30)
26. Gender: (1) = Male (2) = Female
27. Number of years of school completed:
(1) = less than 8 years (3) = 12-under 16 years
(2) = 8-under 12 years (4) = 16 years or more
28. Marital status: (1) = Married (2) = Single or other
29. Number of people in household: persons
30. Age: years
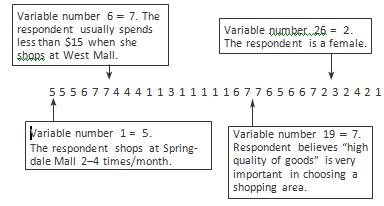
Each respondent in this database is described by 30 variables. As an example of their interpretation, consider row number 1. This corresponds to respondent number 1 and contains the following information.
Attachment:- table.rar