Background:
Performance Drinks, LLC is owned by Dave N. Port. Performance Drinks produces a variety of sports centered drinks. They started operations in 1993 shortly after Mr. Port graduated with his M.B.A. from Davenport University. Company saw early success as sports and fitness nutritional products gained new popularity in the 1990’s. Financially company is sound and has been wise in controlling their growth over the years. However, within the last 18 months Mr. Port has noticed a drop in overall company profitability. This is especially troubling considering that the company has continued to experience top-line growth. Mr. Port and his management team have been considering developing a new product line. However, those plans have been put on hold until they can figure out why their profits are shrinking.
Performance Drinks makes four different kinds of sports drinks. Those drinks are as follows:
• Basic
• Hydration
• Intensity
• Post-Workout
Each of these drinks contains a slightly varied nutritional profile and is targeted for different users and uses. The Basic drink has the least nutritional benefit and is targeted for general consumption. The Hydration product targets endurance athletes and specializes in hydration replacement. The Intensity product was designed with energy enhancement in mind. It serves the needs of extreme athletes who need long durations of sustained energy. At last, the Post-Workout product is a nutritional replacement product that is generally used following exertion.
You are the Controller for Performance Drinks. You feel as though you have a good handle on the financial reporting and the overall company performance. However, admittedly, your accounting information system has been designed to serve the needs of external users from an aggregate perspective. To that end you utilize absorption costing exclusively within the organization. You recall studying the concept of Activity Based Management (ABM) and Activity Based Costing (ABC) while taking a managerial accounting course. You wonder if applying those ideas to your business would help to uncover the mystery of the disappearing profits.
You recall from your Management Accounting class that product costs are comprised of:
• Direct Materials
• Direct Labor
• Manufacturing Overhead
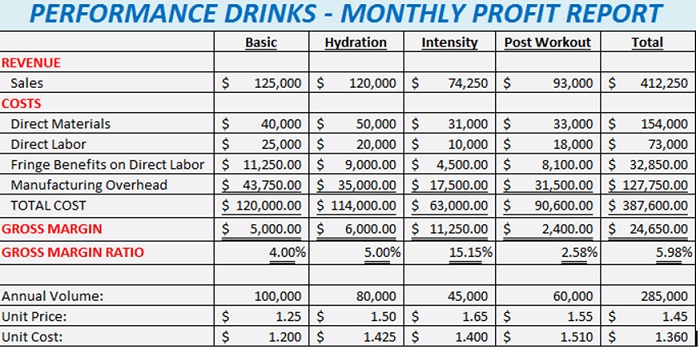
You don’t suspect that anything strange is going with your direct costs. You do wonder, however, if a more thorough understanding of your indirect costs may be in order. Over a series of weeks you talk with a variety of employees, representing a multitude of functional areas, from within the company. During those conversations you take careful note on what activities might be consuming resources and how those activities might be measured. You sharpen your pencil and begin to unpack what you’ve learned. You start with reviewing last month’s Product-Level Profit Report. That report is following:
Since your primary area of focus is on the indirect costs you compile the following report which further details your overhead charges:
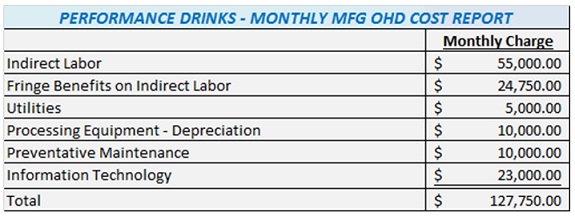
Overhead Activities:
Using traditional costing methods, which support your absorption costing system, you base overhead allocation on direct labor cost. Furthermore, “fringe benefits” are a function of direct labor cost.
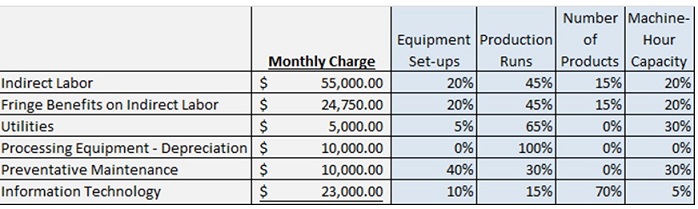
As a result of your many meetings to discuss company overhead you determine that the majority of your indirect costs are related to four primary activities. Those activities are equipment set-ups, production runs, production management and machine-hour capacity. “Production Management” refers to a number of items that are correlated to the number of products the company produces. Ultimately you determine that your key activities have the following usage patterns, as they pertain to the monthly overhead costs:
Upon reviewing budget data from the last budget cycle you discover that the monthly number of set-ups was estimated to be 85. The number of production runs was estimated to be 250. That monthly machine-hour capacity is presently at 20,000 machine-hours. Lastly, Performance Drinks produces a total of four products.
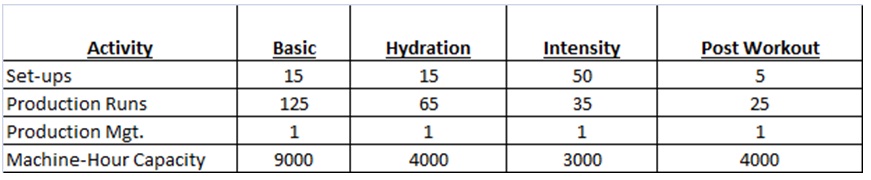
After talking with the Plant Manger you create the following usage data relative to products and activities:
Requirements:
1. Based on all of the date provided, compute the cost driver rates for each of the four activities.
2. Calculate the per unit product costs for each of the four products.Claculate this cost using ABC allocation for overhead. Show the computation for each per unit product cost in detail.
3. Prepare a “Monthly Profit Report”, like the one provided above of this packet. Make this report using the results of your ABC overhead allocation.
4. Make a written “Management Report” that describes the management team what Activity Based Costing is, how it was used to generate Monthly Profit Report (from requirement #3). Describe why the profit for each product is different when comparing the Traditional report with the ABC report. Explain what the company might consider doing, based on all of this information, to stop the erosion of company profits. Defend your recommendations with data.
Additional Consideration:
Mr. Port wonders what would happen to costs if plant capacity was shifted from 20,000 machine-hours a month to 40,000 machine-hours per month.
Requirements:
5. Calculate the new cost per unit for each of the products considering the increase in capacity. Show the computation for each per unit product cost in detail.
6. What is the cost of the unused capacity if it is assumed that the company has 40,000 machine-hours of capacity but it using 20,000 machine-hours? Amend your “Management Report” to include a discussion on how to best use the additional capacity.
Clarification on format and data:
Clear communication and professional is more important. Defending your answer with data is important.
• You would create one professional report. In that report you must clearly label all of your answers. Make your answers easy to read and find.
As it pertains to requirement #4, include the “Management Report” inside your overall report. You would then have one Word document as your final product. You would also have one Excel file.
• Use the following naming structure for your files: last name_first initial_case2.docx. Of course your Excel file will have an .xls suffix.
• Double space your report.
• Your report should have a title page. Use APA 6th edition for guidance on title pages.