Assignment:
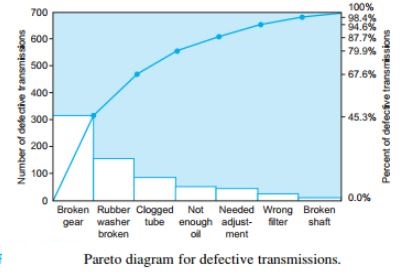
A tractor manufacturing plant has been experiencing problems with the division that makes the transmissions. A Pareto diagram, shown in Fig., has been constructed based on recent experience.
a. What is the most important problem, in terms of the number of transmissions affected? What percent of all difficulties does this problem represent?
b. What is the next most important problem? What percent does it represent?
c. What percent of defective transmissions do the top two problems, taken together, represent?
d. What percent of problems do the top three problems together represent?
e. Write a paragraph, as if to your supervisor, summarizing the situation and recommending action.
Your answer must be typed, double-spaced, Times New Roman font (size 12), one-inch margins on all sides, APA format and also include references.