Problem 1) Sam’s Pizza is a restaurant business in Cincinnati. His income statement for 2006 shows the following:
Net Sales $ 70,000
Cost of Goods Sold $ 34,000
Selling, general and admin expenses $ 20,000
Operating Income $ 16,000
Assume that Sam’s Pizza had a 10% increase in sales in 2007 and that there was no change in costs except for increases associated with the higher volume of sales. Compute the predicted 2007 operating income and its percentage increase. Explain why the percentage increase in income differs from the percentage increase in sales.
Problem 2) Henrietta’s Transistors changed its production operations from one requiring a large labor force to an automated facility dominated by computer controlled robots. This has improved the quality, reliability and flexibility of production schedules and allowed Henrietta to better match the competition. As a result of the change, variable costs fell and fixed costs increased as shown in the following assumed budgets:
Old Production Operation New Production Operation
Variable Unit Cost
Material $0.75 $0.75
Labor $1.90 $0.85
Total Variable per unit $ 2.65 $1.60
Monthly Fixed Expense
Rent and depreciation $500,000 $900,000
Supervisory Labor $ 70,000 $195,000
Other $ 50,000 $100,000
Total Fixed per Month $620,000 $1,195,000
Expected volume is 700,000 per month with each unit selling for $4. Capacity is one million per month.
a. Compute the budgeted monthly profit at the expected volume of 700,000 units under both old and new operations.
b. Compute the budgeted break-even volume under both old and new operations.
c. Compute the budgeted monthly profit if volume falls to 500,000 units under both old and new operations. Discuss the result.
d. Compute the budgeted monthly profit if volume rises to 900,000 units under both old and new operations. Discuss the result.
e. Comment on which operation presents the most financial risk to the company.
Problem 3) Create an Excel spreadsheet to perform CVP analysis an show the relationship between price, costs and break-even points in terms of units and dollars. Use the results to answer questions about your findings. Instructions for creating the spreadsheet for the 2003 version of Excel can be found with problem 2-65 in the text. Using those instructions are optional, but the goal is still to create a presentable spreadsheet that shows the selling price, variable cost, contribution margin, contribution margin ratio, fixed costs, breakeven in units and breakeven in dollars for all three proposals.
Scenario: Dunstan Plastics is investigating three proposals for tool packaging for Craftsman Drills. Under all proposals, the fixed costs would be $200,000. Under proposal A, the selling price would be $10 and the variable unit cost would be $6. Under proposal B, the selling price would be $14 and the variable unit cost would be still be $6. Under proposal C, the selling price would be $10 and the variable cost would be $5.56.
When you have completed your spreadsheet, answer the following questions:
a. What are the break-even points in units and dollars under Proposal A?
b. How did the increased selling price under proposal B impact the break-even points in units and dollars compared to the break-even points calculated under proposal A?
c. Why did the change in variable cost under proposal C not impact the break-even not impact the break-even points in units and dollars as significantly as proposal B did?
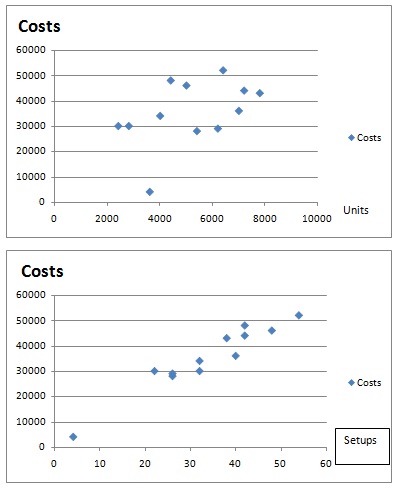
Problem 4) David and Henry’s Ice Cream is produced in a number of flavors. All flavors are produced in the same production line, but the line must be reset between each flavor run to change the ingredient feeds. At the same time, there is ongoing maintenance of the production line to prevent and correct problems during production runs. Unfortunately, David and Henry’s cost accounting has not been able to capture the costs for these two different activities. There is discussion of increasing the variety of flavors produced, so the CFO wants to know how this might impact the maintenance costs of the production line. The CFO has collected the data on the numbers of grosses of gallons of ice cream produced each month as well as the number of times that the production line is reset each month. The data is listed below along with the scatter diagrams of the data for each potential cost driver, grosses of gallons and setups. In one month, April, the plant was closed unexpectedly for much of the month.
a. Find the monthly fixed maintenance cost and the variable maintenance cost per driver item using the visual fit method. Explain how you treated the April data.
b. Find the monthly fixed maintenance cost and the variable maintenance cost using the high-low method on each potential cost driver.
c. Which cost driver (gallons or setups) best predicts the maintenance costs for the CFO?
|
Units
|
Costs
|
Setups
|
|
2400
|
30000
|
22
|
|
2800
|
30000
|
32
|
|
3600
|
4000
|
4
|
|
4000
|
34000
|
32
|
|
4400
|
48000
|
42
|
|
5000
|
46000
|
48
|
|
5400
|
28000
|
26
|
|
6200
|
29000
|
26
|
|
6400
|
52000
|
54
|
|
7000
|
36000
|
40
|
|
7200
|
44000
|
42
|
|
7800
|
43000
|
38
|