Question 1: Consider two structural models given by the following system of equations (Note: These are two independent models):
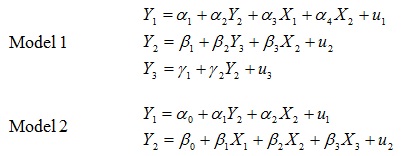
For each system:
a) Determine which equations are under-identified, just-identified, and over-identified. Give justification for your responses.
b) Explain how you would estimate the identified equations (both the just-and over-identified equations)
Question 2: Using a sample of 545 full-time workers in the United States, a researcher is interested in whether women are systematically underpaid compared to men. First, she estimates the average hourly wages in the sample for men and women, which are $5.91 and $5.09, respectively.
a) Do these numbers answer the question of interest? Why not? How could one (at least partially) correct for this?
The researcher also runs a simple regression of an individual’s wage on a male dummy, equal to 1 for males and 0 for females. This gives the results reported in Table below:
Table: Hourly wages explained from gender: OLS results
Variable Estimate Standard Error t-ratio
Constant 5.09 0.58 8.78
Male 0.82 0.15 5.47
N = 545 s = 2.17 R2 = 26%
b) How can you interpret the coefficient estimate of 0.82? How do you interpret the estimated intercept of 5.09?
c) How do you interpret the R2 value?
d) Explain the relationship between the coefficient estimates in the table and the average wage rates of males and females.
e) A student is unhappy with this model because “a female dummy is omitted from the model.” Comment upon this criticism.
f) Using the results in Table above, test the hypothesis that men and women have, on average, the same wage rate, against the one-sided alternative that women earn less. State the assumptions required for this test to be valid.
Question 3: Given the model, yt = αo + Φ1yt-1 + εt answer the following questions.
a) Assume that εt ˜ N(0, σ2) What type of time series model is this?
b) Graph the value of y against t for 10 periods when ε1= 0.2, φ = 0.8 and a0 = 0.
c) Draw an appropriate ACF and PACF plot for the model given in this question.
Question 4: Consider the following OLS regression between the 1975 Wages for 428 married women versus their actual experience in the labor market and their years of education (1976 Panel Study of Income Dynamics, Mroz(1987).
log(wage) = - 0.400 + 0.0160 x Exper + 0.1095 x Educ
The data set was analyzed using SAS. Partial output in tabular form is presented below:
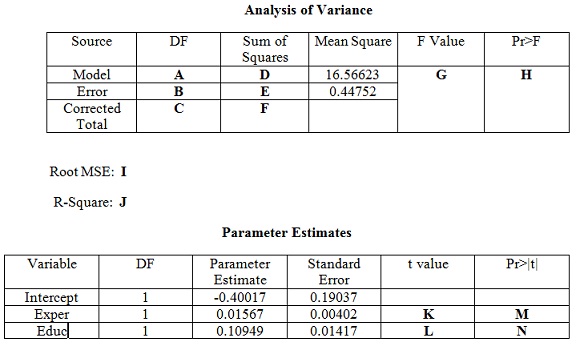
a) Calculate the values associated with the letters A through N.
b) Interpret the coefficients associated with Exper and Educ.
Question 5: A criminologist is interested in studying the following question: “Is the death penalty applied in a racially discriminatory fashion?” To answer this question, data were collected for 100 death penalty cases in the State of Georgia. Logistic regression was used with the binary dependent variable death penalty against a number of independent variables. The analysis is set up to obtain the predicted probability of getting the death penalty (death penalty = 1). The independent variables were defined as follows:
blkdef = 1 if black defendant; 0 otherwise.
whtvict = 1 if white victim; 0 otherwise.
aggcirc = number of aggravating circumstances.
fevict = 1 if female victim; 0 otherwise.
stranger =1 if stranger victim; 0 otherwise.
multvic = 1 if 2 or more victims; 0 otherwise.
multstab = 1 if multiple stabs; 0 otherwise.
yngvict = 1 if victim 12 or younger; 0 otherwise.
A partial output table is given below:
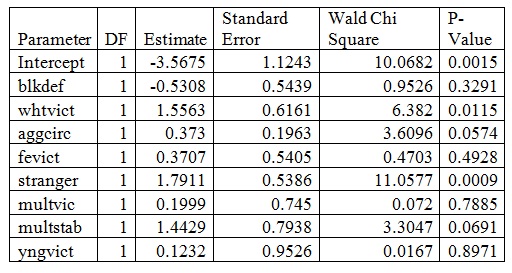
a) Holding all other variables constant and using a type I error rate of 5%, are black defendants more likely to get the death penalty than white defendants? Why or why not? Interpret the coefficient for blkdef.
b) Calculate the odds ratio of getting the death penalty for a defendant whose crime was against a white defendant. Is this odds ratio statistically significant using a type 1 error rate of 5%. Interpret the odds ratio.
c) What is the predicted probability of getting the death penalty for a black defendant who kills a white (female) victim who is a stranger with two aggravating circumstances, multiple victims, multiple stabs, and a victim younger than 12 years of age? What would the prediction be if all that changed was that the defendant was not black?
d) The regression coefficients for multvic and yngvict are not statistically significant. Make an argument for why we would include these independent variables in the logistic regression model even though their regression coefficients are nonsignificant.