Question 1
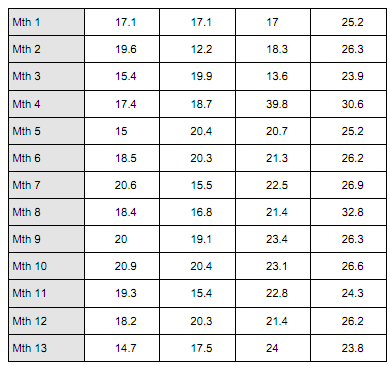
Suppose Procter & Gamble sells about 20 million bars of soap per week, but the demand is not constant, and production management would like to get a better handle on how sales are distributed over the year. Let the following sales figures, given in units of million bars, represent the sales of bars per week over one year. Construct a histogram to represent this data. What do you see in the graph that might be helpful to the production (and sales) people?
Question 2
A Travel Weekly International Air Transport Association survey asked business travellers about the purpose for their most recent business trip. 19% responded that it was for an internal company visit. Suppose 950 business travellers are randomly selected.
(a) What is the probability that more than 25% of the business travellers say that the reason for their most recent business trip was an internal company visit?
(b) What is the probability that between 15% and 20% of the business travellers say that the reason for their most recent business trip was an internal company visit?
(c) What is the probability that between 133 and 171 of the business travellers say that the reason for their most recent business trip was an internal company visit? Please be sure to include all workings with your answers.
Question 3
Where do CFOs get their money news? According to Robert Half International, 47% get their money news from newspapers, 15% get it from communication/colleagues, 12% get it from television, 11% from the internet, 9% from magazines, 5% from radio, and 1% do not know. Suppose a researcher wants to test these results. They randomly sample 67 CFOs and find that 40 of them get their money news from newspapers. Does the test show enough evidence to reject the ?ndings of Robert Half International? Use = 0.05.
Note: You will need to explain how you determined the answer to the question. Submitting answers without an explanation for this question is not sufficient.
Question 4
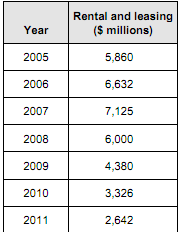
Shown below are a set of rental and leasing revenue ?gures for office machinery and equipment over a seven-year period. Use this data to run a linear regression and then forecast the rental and leasing revenue for the year 2012. You will need to use the charting features in Excel for this question.
Question 5
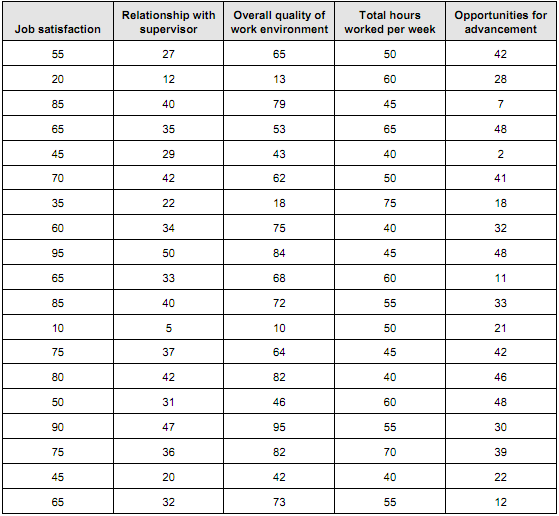
Suppose a researcher gathered survey data from 19 employees and asked the employees to rate their job satisfaction on a scale from 0 to 100 (with 100 being perfectly satis?ed). Suppose the following data represents the results of this survey. Also assume that:
• the relationship with the supervisor is rated on a scale from 0 to 50 (0 represents a poor relationship and 50 represents an excellent relationship)
• overall quality of the work environment is rated on a scale from 0 to 100 (0 represents a poor work environment and 100 represents an excellent work environment)
• opportunities for advancement is rated on a scale from 0 to 50 (0 represents no opportunities and 50 represents excellent opportunities).
Answer the following questions:
(a) What is the regression formula?
(b) How reliable do you think the estimates will be based on this formula? How can you tell?
(c) Are there any variables that do not appear to be good predictors of job satisfaction? How can you tell?
(d) If a new employee reports that her relationship with her supervisor is 40, finds the quality of the work environment to be scored at 75, works 60 hours per week and rates her opportunities for advancement to be at 30, what would you expect her job satisfaction score to be?
Question 6
Investment analysts generally believe the interest rate on bonds are inversely related to the interest rate for loans; that is, bonds perform well when lending rates are down and perform poorly when interest rates are up. Can the bond rate be predicted by the interest rate?
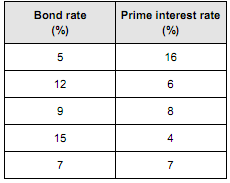
Use the following data to construct a scatter graph and then fit a regression line to the data. Report the regression formula and the r-squared value from the chart (right-click on the line, select 'Add Trendline' and select options to show these metrics).
Question 7
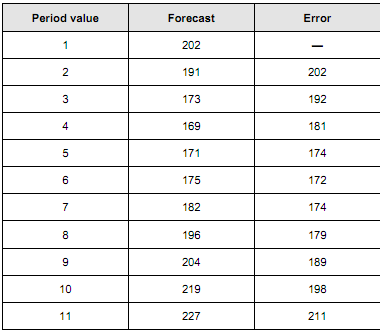
Determine the error for each of the following forecasts. Compute MAD and MSE.
Question 8
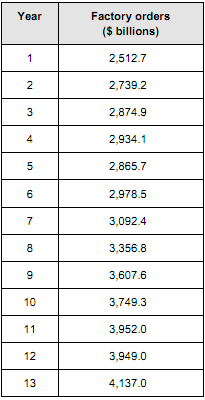
Shown below is data on factory orders for all manufacturing, durable goods, and non-durable goods industries over a 13-year period ($ billion).
(a) Use this data to develop forecasts for the years 6 through 13 using a 5-year moving average.
(b) Use this data to develop forecasts for the years 6 through 13 using a 5-year weighted moving average. Weight the most recent year by 6, the previous year by 4, the year before that by 2, and the other years by 1.
(c) Compute the errors of the forecasts in parts (a) and (b) and then the mean absolute deviation (MAD). Which forecast is better?
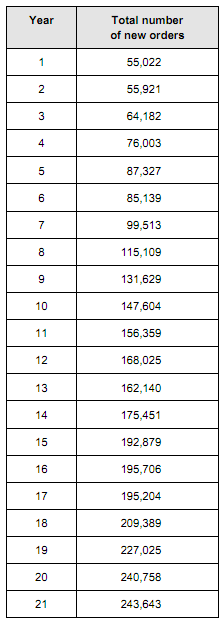
Question 9
The ‘Economic Report to the Director' included data on the amounts of manufacturers' new and un?lled orders in millions of dollars. Shown below are the ?gures for new orders over a 21-year period. Use Excel to develop a regression model to fit the trend effects for the data. Use a linear model and then try a quadratic model. How well does either model ?t the data? For this question you will need to use the regression tool from the Analysis Toolpak.