Question 1: Consider the following times series for a 2 goods (Bourbon and Cigars) Economy:
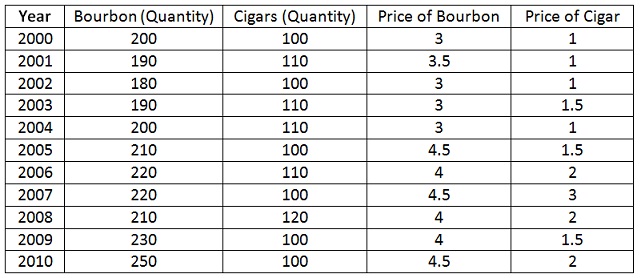
a) Calculate and Plot using a spreadsheet (like Ms Excel) the series for Nominal GDP.
b) Calculate and Plot using a spreadsheet the series for Real GDP (i.e. normalize by the price of Cigar)
c) Calculate and Plot using a spreadsheet the yearly % changes in Nominal GDP (i.e. [GDPt+1-GDPt]/GDPt)
d) Calculate and plot using a spreadsheet the yearly % changes in Real GDP.
e) The yearly % change of Nominal GDP in 2003 (i.e. [GDP2003-GDP2002]/GDP2002) is positive but the yearly % change in Real GDP in 2003 is negative. Why?
For part a), b), c) and d) you may summarize the results of your calculations in table above.
Question 2: Build the annual Index of Openness for Australia and Italy (1970-2011)
For this question, you will have to go on https://stats.oecd.org/. Under National Accounts, select Annual National Accounts, then Main Aggregates, then GDP.
a) Customize your selection so that you obtain data only for Australia, for the time period 1970-2011, in US$, current prices, current PPPs, millions.
b) Build the time series for the Index of Openness (Export of Goods/GDP) using a spreadsheet
c) Build the time series of Imports of Goods/GDP.
d) Plot the time series from b) and c).
e) Repeat the a), b) for Italy. Plot the series for the Index of Openness for Australia and Italy together.
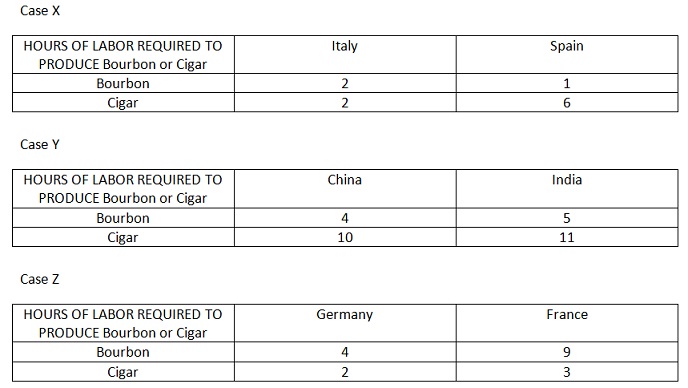
Question 3: Absolute and Comparative Advantage
For the following Cases (X, Y and Z), determine:
a) Who has the absolute advantage at producing Cigar?
b) Who has the comparative advantage at Bourbon?
c) What is the relative price of Bourbon in terms of Cigars in Autarky in both countries?
d) If the 2 countries open to trade, there will be ONE world price (Terms of Trade); what is the interval (i.e. the min and the max) of Terms of Trade under which trade is beneficial?
e) What is the range of possible Relative Wage Ratio under which trade based on comparative is mutually beneficial?
Question 4: Suppose France has 1000 workers available and each of them is able and willing to work exactly 3 hours per week. France’s technology is described in Case Z from Exercise 3. Suppose Germany has 2000 worker-hours available for production and each of them is able and willing to work exactly 2 hours per week. Germany’s technology is described in Case Z from Exercise 3. Imagine we have a free trade agreement between the two countries.
a) Derive the PPF (for 1 week) for both countries and graph them (on the same graph)?
b) Who is specializing in Bourbon according to Comparative Advantage?
Now imagine that a law passes in France such that French workers MUST work a total of 2 hours per week.
c) Derive the PPF (for 1 week) for both countries and graph them (on the same graph)?
d) Who is specializing in Bourbon according to Comparative Advantage now? Why?
Now imagine that the German government imposes workplace safety laws that impact the production of Bourbon, but not Cigars; the amount of hours of labor required to produce Bourbon is now 10 in Germany
e) Derive the PPF (for 1 week) for both countries and graph them (on the same graph)?
f) Who is specializing in Bourbon according to Comparative Advantage now? Why?