Assignment:
Question 1 (a) A company selling skirts, trousers and jackets online codes the primary reason given by customers when items are returned as ‘Wrong colour', ‘Wrong size' or ‘Other. The data that were gathered about returns in one month are given in Table.
Item Primary reason
Wrong colour Wrong size Other Total
Skirt 24 34 12 70
Trousers 156 72 44 272
Jacket 16 10 32 58
Total 196 116 88 400
Now suppose that one returned item is selected at random.
(i) Calculate the probability that the selected item is a jacket returned primarily because it was the wrong colour.
(ii) Calculate the probability that the selected item is not a skirt. You should perform this calculation in two different ways - one way that involves the probability rule for complementary events, and one way that does not.
(b) Three friends, Ash, Kim and Josh, meet every Wednesday to go out for a run. If all agree, they go for a long run rather than a short run. Based on previous experience, the probability that Ash is up for a long run is 0.4, the probability that Kim is up for a long run is 0.3, and the probability that Josh is up for a long run is 0.7.
What is the probability that Ash, Kim and Josh are all up for a long run the next time they meet? State any important assumptions that you make in order to calculate this probability.
(c) A random sample of size 6 is selected from a certain population.
(i) Calculate, by hand, the probability that exactly five of the six selected values lie above the population median. Show your working.
(ii) Calculate, by hand, the probability that at least four of the six selected values lie above the population median. Again, show your working.
Question 2 The Minitab file that you require for this question should be downloaded from the ‘Assessment' area on the module website.
The Minitab worksheet cet.mtw contains two columns.
• The first column, headed temp2015, gives the daily mean temperature in Central England, in degrees Celsius, for 16 randomly selected days in 2015.
• The second column, headed temp2016, gives the corresponding daily mean temperature (in degrees Celsius) in Central England for the same 16 days in 2016, exactly one year after the temperature given in the first column.
Run Minitab and open the worksheet.
(a) Use Minitab's Calculator facility to work out the differences between the values recorded for the daily mean temperatures, and put the resulting differences in a new column called difference; that is, set difference = temp2016 - temp2015. List the values of difference as your answer to this part of the question.
(b) In part (c) you will use Minitab to perform a sign test to address the question of whether or not temperatures in 2016 were the same as temperatures in 2015. Specify an appropriate hypothesis that the sign test can be used to test.
(c) Use Minitab to perform an appropriate sign test on the differences.
Include a copy of the relevant Minitab output in your answer.
(d) Give the p-value from the test performed in part (c), and say what may be concluded from the test in terms of evidence about the hypothesis. Relate your conclusion back to consideration of temperatures in 2015 and 2016.
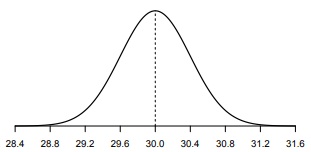
Question 3 (a) For the normal distribution shown in Figure, find approximate values for its mean and standard deviation.
(b) Assume that the population distribution of the weights of healthy female Bengal cats, w, is a normal distribution with mean µ = 4.95 kg and standard deviation σ = 0.15 kg.
(i) Sketch this distribution.
(ii) Find the formula for z that converts each value of the variable w to the number of standard deviations from its mean.
(iii) Calculate the value of z corresponding to a female Bengal cat whose weight is 5.25 kg. Interpret your answer by completing a sentence of the form: ‘So a weight of 5.25 kg is times a standard deviation the mean weight of healthy female Bengal cats of.
(iv) Suppose now that at a cat show, 45 healthy female Bengal cats have been entered. What is the standard deviation of the sample mean weight of these cats?
(v) Hence give the approximate distribution of the sample mean weight of the healthy female Bengal cats that have been entered in this cat show.
Question 4 A comparative study was undertaken to test the effect of music on the attractiveness of a game on a mobile phone. To do this, a group of 156 volunteers were recruited. 84 of these volunteers were randomly chosen to play the game with the music on, and the remaining 72 played the game in silence. The length of time each volunteer played the game for the first time before they got bored was recorded.
For the group that played the game with music, the mean time they played the game for the first time was 39.2 minutes, and the sample standard deviation was 8.2 minutes. For the group that played the game in silence, the mean time they played the game for the first time was 36.2 minutes, and the sample standard deviation was 9.4 minutes.
A hypothesis test is to be performed to investigate whether the lengths of time the volunteers played the game for the first time in the two groups are different.
(a) Name the hypothesis test that it is appropriate to use in this situation.
(b) Using appropriate notation, which you should define, specify the null and alternative hypotheses associated with the test.
(c) Calculate the value of the estimated standard error of the difference between the sample means.
(d) Calculate the value of the test statistic.
(e) The sample sizes are both greater than 25, so you can assume that when the null hypothesis is true, the test statistic follows (approximately) the standard normal distribution. Complete the hypothesis test, carefully detailing the conclusions of the test.
Question 5 At a particular sandwich stall, the following statements are true.
• 40% of customers bought a packet of crisps.
• Of the customers who bought a packet of crisps, 10% also bought a bar of chocolate.
(a) Let C denote the event of a customer buying a packet of crisps, and let S denote the event of a customer buying a bar of chocolate. Write the information given in the two bullet points in symbolic form.
(b) Calculate the probability that a randomly chosen customer buys a packet of crisps and a bar of chocolate.
(c) Additional information is now given that 25% of customers buy a bar of chocolate. Calculate the probability that a randomly chosen customer who buys a bar of chocolate also buys a packet of crisps.
(d) What percentage of customers buy a bar of chocolate or a packet of crisps or both?
(e) Why do these data suggest that customers buying a bar of chocolate and customers buying a packet of crisps are not independent events?
Question 6. The Minitab file that you require for this question should be downloaded from the ‘Assessment' area on the module website.
In an archaeological study, information about 224 amphora (a type of pot) was gathered.
The locations where the amphora were found were recorded as ‘north', ‘south' or ‘elsewhere'. Also, positions in which the amphora were found were recorded as ‘layer', ‘pit' or ‘other'.
In addition to a first column containing labels, the Minitab worksheet amphora.mtw contains three columns - one associated with each location in which an amphora could be found, N for ‘north', S for ‘south', and E for ‘elsewhere'. It also contains three rows - one associated with each of the three positions in which an amphora was recorded as being found. The numbers in the resulting contingency table are the counts of amphora recorded as being found in each position and location. Run Minitab and open this worksheet.
The data in amphora.mtw are to be analysed using a χ2 test for contingency tables.
(a) Explain why the table in amphora.mtw is indeed a contingency table.
(b) Specify the null and alternative hypotheses associated with the χ2 test.
(c) Perform the χ 2 test using Minitab. Include a copy of the relevant Minitab output in your answer. Identify the expected value for the number of amphora found in the ‘south' and in a ‘pit'.
(d) The smallest observed value in the table, that for amphora found in a ‘layer' in the ‘north', is 2. Explain why this does not cast doubt on the validity of the χ 2 test that you carried out, and give the reason why the χ2 test is valid in this case.
(e) Minitab gives the degrees of freedom associated with this χ2 test as 4. Show how this value arises.
(f) Interpret the results of the χ2 test, giving your conclusions about the relationship between the locations and positions where amphora were found.
(g) State whether a type 1 or type 2 error might have occurred.
Question 7 Figure shows a scatterplot of x and y values for each of 400 data points in a sample.
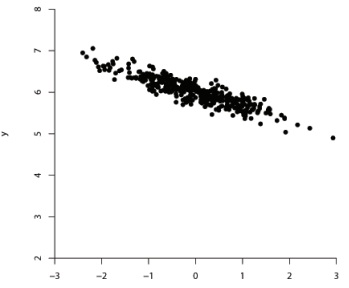
The correlation coefficient associated with Figure is claimed to b
The correlation coefficient associated with Figure is claimed to be +0.226.
In answering parts (a) and (b) of this question, give reasons for your answers.
(a) Is the value claimed for the correlation coefficient plausible in terms of its closeness to 0?
(b) Is the value claimed for the correlation coefficient plausible in terms of its sign?
In parts (c), (d) and (e) of this question, further statements are made about the relationship between x and y in Figure. In each case, state whether or not the statement is correct, again giving a reason for each answer.
(c) If each value of the y variable is divided by four, then the value of the correlation coefficient will also be divided by four.
(d) If the values of x and y are swapped over, then the value of the correlation coefficient will have the same sign as the value associated with Figure.
(e) Figure shows that the variable x causes the variable y to take the values that it does.
Question 8. A particular bank wants to determine the average amount of time that cashiers spend serving each customer. It obtains data from 49 customers; the sample mean time taken (in minutes) by a cashier to serve a customer is 5.80, and the sample standard deviation of the time taken is 1.68.
(a) Calculate the value of the estimated standard error of the sample mean.
(b) Calculate a 99% confidence interval for the population mean time that a cashier takes to serve a customer.
(c) Interpret the confidence interval from part (b) in terms of all possible random samples of the time that a cashier takes to serve a customer.
(d) On the basis of the confidence interval from part (b), what would have been the outcome of a z-test of the null hypothesis that the population mean time that a cashier spends serving a customer is 6.5 minutes?