Assignment:
Question 1
In a cohort study investigating the risk factors for typhoid fever in the Mekong Delta, Southern Vietnam, there were 95 patients admitted with blood culture-confirmed typhoid fever and 178 healthy patients.
a) Calculate the observed proportion of patients with typhoid fever in the Mekong Delta, Southern Vietnam.
b) Calculate and interpret a 90% confidence interval for the population proportion.
c) Calculate the sample size required to obtain an estimate of the population proportion of patients with typhoid fever in the Mekong Delta, Southern Vietnam with a precision of ± 5% (i.e. half the width of the 95% confidence interval is 5%). For an initial estimate of the population proportion use the value calculated in part (a).
Do you expect the estimate of the required sample size to change if the estimate of the population proportion computed in part (a) is reduced by 10%? Justify your answer.
Question 2
A randomised controlled trial comparing enalapril versus placebo in patients with congestive heart failure is said to have 75% power to detect a 15% relative reduction in the risk of death (RR=0.85) 12 months following treatment at the 5% level of significance.
a) What is the probability that this trial would fail to detect a true risk ratio of 0.85? Explain how you have reached your answer.
b) How could the probability of failing to detect a true risk ratio of 0.85 be reduced?
c) What information required for a power-based sample size calculation is not given above?
d) In a power-based sample size calculation, what would happen to the estimated sample size if: (i) the level of significance was increased from 5% to 10%, (ii) the power to detect a 15% relative reduction in the risk of death was increased from 75% to 80%? Justify your answers.
Question 3
Within the first year of life, about 50% of infants have an acute respiratory illness. The data in Table (see below) are from a prospective cohort study that was conducted to examine the relationship between a mother's exposure to passive smoking during pregnancy and acute respiratory illness in infants during the first year of life. Mothers were recruited antenatally (before birth) and, at the time of recruitment, asked about their exposure to passive smoking during pregnancy. The mothers were then followed up for 12 months post pregnancy and any episodes of infant respiratory illness were recorded.
Table
Exposure to Respiratory illnes
passive smoking Yes No Total
Yes 117 50 167
No 198 139 337
Total 315 189 504
Use the data in the above table to answer the following questions:
a) Calculate and interpret: (i) the risk difference, (ii) the risk ratio, and (iii) the odds ratio.
b) Calculate and interpret the 95% confidence interval for: (i) the risk difference, (ii) the risk ratio, and (iii) the odds ratio.
c) Use the estimated odds ratio and the standard error of the odds ratio to calculate and interpret the p-value for the null hypothesis of no association between exposure to passive smoking and respiratory illness.
If the results for this study were being reported to the general public (e.g., on TV or in newspapers), which measure of association would you choose to report? Why?
Question 4
This question concerns a hypothetical case-control study investigating the association between cholesterol levels and coronary heart disease. The investigators were concerned that sex may confound the association between cholesterol levels and coronary heart disease. The data were therefore stratified by sex (see Table 2 below).
|
Cholesterol level
|
Male
|
Female
|
|
Coronary heart
disease
|
Control
|
Coronary heart
disease
|
Control
|
|
High
|
125
|
77
|
84
|
95
|
|
Low
|
29
|
55
|
60
|
200
|
a) Calculate and interpret the unadjusted (crude) odds ratio for coronary heart disease associated with high cholesterol level.
b) Calculate the odds ratio for coronary heart disease associated with high cholesterol levels for males and females separately. How do the stratum-specific odds ratios compare with each other and the unadjusted odds ratio calculated in part (a)?
c) Calculate and interpret the Mantel-Haenszel estimate of the pooled odds ratio. Comment on whether or not confounding is present.
Question 5
In order to answer this question, you will need to use the Stata dataset surgery.dta, which can be downloaded from the folder "Assignment 2" in the Assessment area on the LMS.
Tissue oxygenation is known to be a predictor of surgical site infection. It is believed that improving tissue oxygenation reduces the risk of infection during surgery. A technique that may improve tissue oxygenation is to use supplemental inspired oxygen during or after surgical treatment.
The Stata dataset surgery.dta contains data from two randomised controlled trials (RCTs) comparing the use of supplemental oxygen (during or after surgery) versus standard surgery in patients undergoing colorectal resections. The outcome measure of each trial was incidence risk of surgical site infection. A detailed description of the data is below:
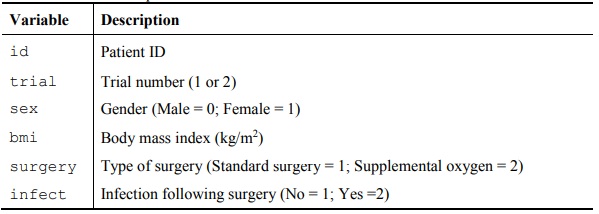
The researchers believe that the use of supplemental oxygen decreases the risk of infection following surgery (in comparison to the standard treatment) in males who are of healthy weight (BMI ≥ 19 and BMI < 25). A reduction in the risk of infection following surgery of 10% or more (RR=0.90) corresponds to a clinically important effect.
Please include all Stata code (i.e., the DO file) that was used to solve Question 5 in the appendix of your report. Please ensure that your Stata code includes appropriate comments.
a) The researchers are only interested in the effects of supplemental oxygen on surgery infection in males who are of healthy weight (BMI ≥ 19 and BMI < 25). Using Stata, complete the missing entries in Table.
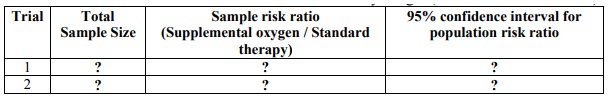
b) What is your interpretation of the results of trials 1 and 2 using all the information in Table (that is, the total sample size of each trial, the sample risk ratio, and the 95% confidence interval for the population risk ratio)?
c) If the two trials in Table 3 were the only studies currently available with data comparing supplemental oxygen and standard surgery, would you recommend the use of supplemental oxygen in surgery for males who are of healthy weight? Please explain.
Question 6
In order to answer this question, you will need to use the Stata dataset diabetes.dta, which can be downloaded from the folder "Assignment 2" in the Assessment area on the LMS. This question explores important risk factors associated with diabetes among Aboriginal and Torres Strait Islander (TSI) people using a hypothetical cross-sectional study. A detailed description of the data from this hypothetical study is in Table below.
Table shown. Description of the Stata dataset diabetes.dta
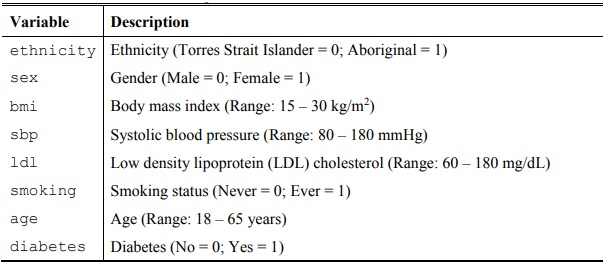
The primary outcome variable in the study is diabetes (i.e., diabetes). Based on previously published research, the investigators expect to observe an association between diabetes and high blood pressure. However, the investigators suspect that this association may be confounded by low density lipoprotein (LDL) cholesterol. Additionally, the investigators would like to explore the association between diabetes, blood pressure and LDL cholesterol separately for Aboriginal and TSI people.
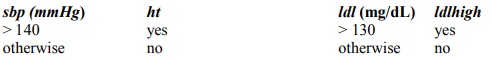
In order to answer Question 6, you will need to create two new categorical variables: ht and ldlhigh. The new categorical variable ht will be a binary variable representing the presence of hypertension. The new categorical variable ldlhigh will be a binary variable representing abnormally high test results for LDL cholesterol. The new variable ht will be derived from the existing numerical variable sbp. The new variable ldlhigh will be derived from the existing numerical variable ldl. The new variables ht and ldlhigh should consist of the following categories:
Before proceeding to answer Question 6, please ensure that:
- All the variables in the data set are correctly labelled;
- The values of all variables have appropriate labels.
Please include all Stata code (i.e., the DO file) that was used to solve Question 6 in the appendix of your report. Please ensure that the Stata code includes appropriate comments.
a) What is the proportion of missing data for each variable (including the derived variables ht and ldlhigh) in the data set? What is the proportion of missing data for diabetes (diabetes) for each category of ldlhigh? Which category of sex (males or females) has the greatest proportion of missing diabetes data?
b) Display the data for ht (i.e., hypertension) and ldlhigh (i.e., high levels of LDL cholesterol) using an appropriate graph or table. Use Stata to compute and interpret an appropriate measure of association between the variables ht and ldlhigh.
c) Use Stata to produce an appropriate graph or table to display the relationship between MI (bmi) and diabetes (diabetes) for TSI people only. Display the graph or table in your assignment document. Which group, TSI diabetics or TSI non-diabetics, has higher BMI on average?
d) Use Stata to calculate and interpret the (unadjusted) odds ratio for the association between diabetes (diabetes) and hypertension (ht), separately for the Aboriginal and TSI people. For each estimated odds ratio, use Stata to calculate and interpret the 95% confidence interval for the corresponding population odds ratio.
e) Use Stata to calculate and interpret the odds ratio and the 95% confidence interval for the population odds ratio between diabetes (diabetes) and hypertension (ht) separately for individuals with high levels of LDL cholesterol (ldlhigh = yes) and those with low levels of LDL cholesterol (ldlhigh = no) for (i) Aboriginal people, and (ii) TSI people.
f) Use Stata to compute and interpret the Mantel-Haenszel estimate of the odds ratio for the association between diabetes (diabetes) and hypertension (ht) pooled over the categories of ldlhigh, separately for (i) Aboriginal and (ii) Torres Strait Islander people.
g) Is there evidence that having high level of LDL cholesterol (ldlhigh) is a confounder of the association between hypertension (ht) and diabetes (diabetes) among Aboriginal and/or Torres Strait Islander people? Justify your answer.