Assignment:
Question 1
The graph below represents the saving function for a certain economy. In this economy people always save 25 cents of any additional dollar in disposable income.
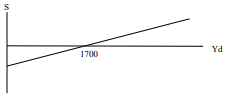
We also have the following information about the economy (assume prices are fixed):
Ip = 500
G = 300
T = 300
X = 150
IM = 100 + .15Y
a. Find the aggregate expenditure (AEp) function for this economy, calculate the equilibrium level of GDP (Ye), and graph your AEp function below. Show your work and label all axes, intercepts, and other relevant points.
b. Suppose that firms in this economy decide to produce 2400 (i.e., suppose that GDP (Y) is 2400). Calculate actual and planned levels of investment and explain clearly in words what is going on in this economy. Be concise and precise. Show your work!
c. Now suppose that income (GDP or Y) in this economy rises by $1 (starting at any initial level). (No calculation needed to report the changes)
i. By how much will the level of spending on all consumption goods change?
ii. By how much will the level of spending on imports change?
iii. By how much will the level of spending on domestic goods change?
Question 2
Suppose that you are given the following information about a perfectly competitive market.
QD=6500-100P (market demand)
QS=1200P (market supply)
You are also given the following information for a firm operating in this market. The lower-case q represents the firm's output.
TC=722 + q2/200
MC=2q /200
a. Determine the profit maximizing price that a firm operating in this market will charge, the quantity they will produce, and the profit for the firm.
b. Explain whether you would expect to see entry into or exit from this industry in the long run and why this is the case. In addition, explain the effect that entry or exit will have on the market equilibrium.
c. Calculate the lowest price at which a firm would sell its output in the long run.
Question 3
Sal's satellite company, which is a monopoly, broadcasts TV to subscribers in Los Angeles and New York. The demand functions for each of these two submarkets are:
QNY= 60 - 0.25PNY
QLA= 100 - 0.50PLA
where Q is in thousands of subscribers per year and P is the subscription price per year. The total cost of providing Q units of service is given by TC= 1000 + 40Q and the marginal cost is MC=40. We also know that Q= QNY + QLA.
a. Suppose this monopoly decides to engage in 3rd degree price discrimination. Calculate the profit-maximizing price and quantity for the New York and Los Angeles markets.
b. Based on your answers in part (a), what can you say about the elasticity of demand in New
York relative to LA? No calculation needed and no reference to just the slope of the demand curve. Explain in words. Be precise and concise.
c. Let's suppose that as a consequence of a new satellite that the Pentagon recently deployed, people in Los Angeles receive Sal's New York broadcasts and people in New York receive Sal's Los Angeles broadcasts. As a result, anyone in New York or LA can receive Sal's broadcasts by subscribing in either city. Can Sal continue to price discriminate? Explain. Based on your response, what price should he charge in New York and Los Angeles? Show your work below
Question 4
Consider a firm that operates in a monopolistically competitive industry. The firm is currently in the short-run and is maximizing its profit. Price is equal to $40 and its total revenue is equal to $800. Average fixed cost is equal to $20 and total cost is equal to $1000.
a. In the space below, draw the firm's demand, marginal revenue, marginal cost, average variable cost, and average total cost curves. Also shade in the firm's total economic profit or loss in your graph. Assume that all cost curves have the usual U-shapes and the demand and MR
curves are downward sloping and make sure they are all consistent with the data above and with each other. Label the axes and all relevant points, such as values for P, Q, ATC, and AVC on your graph. Be precise and label each curve clearly.
b. Should the firm continue to operate or shut down temporarily in the short-run? Explain how you know this.
c. Suppose that several other firms in the industry who are experiencing losses decide to exit the industry. Assume that this firm decides to stay. Redraw your graph from part (a) below (you can leave out the AVC curve). On the same graph illustrate the movement from the short-run to the long-run for this firm that remains in the market. You need to show on the same graph what happens to the firm's price, output, and economic profit as we move from the short-run to the long-run. You can use P2 and Q2 to indicate the new price and output levels. Also make sure to denote any changes in your curves, such as D2 or MR2. Be clear.
Question 5
Suppose that Toyota and GM are considering entering a new market for electric cars and that their profit (in millions of dollars) from entering or staying out of the market are:
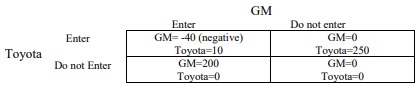
If the firms make their decisions simultaneously, which firms enter? How would your answer change if the U.S. government committed to paying GM a lump-sum subsidy of $50 million on the condition that it would produce this new type of car?
Question 6
A perfectly competitive firm is currently producing 10 units of output. Its current total cost is $85 and its cost curves have the usual shapes. If the firm increased output to 12 units, total cost would rise to $87. The firm's fixed cost is $15. Is Q = 10 the short-run profit-maximizing level of output for this firm? Why or why not? Show your work and explain clearly your reasoning. If you just show an answer with no work, you will not receive full credit.