1.The last four years of returns for a stock are as follows:
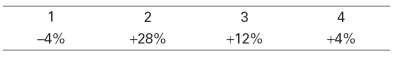
a. What is the average annual return?
b. What is the variance of the stock’s returns?
c. What is the standard deviation of the stock’s returns?
2.Assume that historical returns and future returns are independently and identically distributed and drawn from the same distribution.
a. Calculate the 95% confidence intervals for the expected annual return of four different investments included in Tables 10.3 and 10.4 (the dates are inclusive, so the time period spans 83 years).
b. Assume that the values in Tables 10.3 and 10.4 are the true expected return and volatility (i.e., estimated without error) and that these returns are normally distributed. For each investment, calculate the probability that an investor will not lose more than 5% in the next year? (Hint: you can use the function normdist(x,mean,volatility,1) in Excel to compute the probability that a normally distributed variable with a given mean and volatility will fall below x.)
c. Do all the probabilities you calculated in part (b) make sense? If so, explain. If not, can you identify the reason?
3.Consider an investment with the following returns over four years:
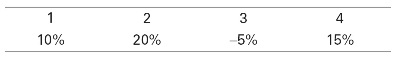
a. What is the compound annual growth rate (CAGR) for this investment over the four years?
b. What is the average annual return of the investment over the four years?
c. Which is a better measure of the investment’s past performance?
d. If the investment’s returns are independent and identically distributed, which is a better measure of the investment’s expected return next year?