Question 1: Consider the following times series for a 2 goods (Bourbon and Cigars) Economy:
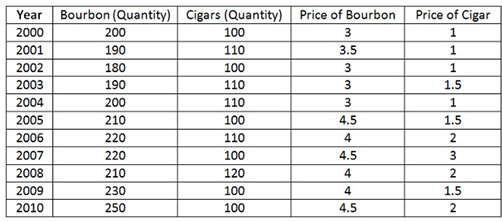
a) Calculate and Plot using a spreadsheet (like Ms Excel) the series for Nominal GDP.
b) Calculate and Plot using a spreadsheet the series for Real GDP (i.e. normalize by the price of Cigar)
c) Calculate and Plot using a spreadsheet the yearly % changes in Nominal GDP (i.e. [GDPt+1-GDPt]/GDPt)
d) Calculate and plot using a spreadsheet the yearly % changes in Real GDP.
e) The yearly % change of Nominal GDP in 2003 (i.e. [GDP2003-GDP2002]/GDP2002) is positive but the yearly % change in Real GDP in 2003 is negative. Why?
For part a), b), c) and d) you may summarize the results of your calculations in table above.