Questions:
Basic Algebra : Mean, Median, Mode and Linear Equations
Place student work and solutions in this column
1. Fiona kept the following records of her phone bills for 12 months:
$42, $37, $51, $41, $58, $44, $42, $35, $53, $58, $46, $57
Find the median of Fiona's monthly phone bills.
2. (a) Find the mean of the following set of numbers.
12, 16, 19, 22, 28, 30
(b) Find the mode of the following set of numbers.
11, 13, 13, 12, 11, 12, 13, 10, 14
3.The graph and table below show the income for a local company.
|
Year
|
Total Income (in millions)
|
|
1980
|
$6.3
|
|
1985
|
$21.5
|
|
1990
|
$39.8
|
|
1995
|
$57.4
|
|
2000
|
$65.3
|
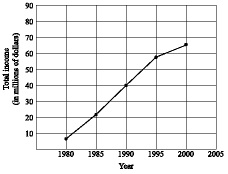
Use this information to predict the income in the year 2005
Use the following to answer questions
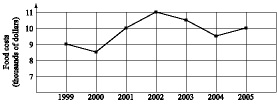
4.Use the graph, showing the yearly food costs of a family.
What was the cost in 2004?
5. Use the graph, showing the yearly food costs of a family.
What was the mean yearly cost (to the nearest cent) of food for this family in the 7 years from 1999 to 2005?
6. Use the graph, showing the yearly food costs of a family.
What was the percent of increase in cost of food for this family for the years 2001 to 2002?
7. Use the graph below, showing the total U.S. motor vehicle production for the years 1996 to 2002, to answer the question.
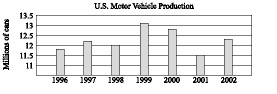
What was the production in 1996?
8. The following table gives the population of certain states according to the 2000 census.
|
State
|
Population
|
|
California
|
33,871,648
|
|
Florida
|
15,982,378
|
|
Michigan
|
9,938,444
|
|
Pennsylvania
|
12,281,054
|
|
Washington
|
5,894,121
|
Construct a bar graph from this information.
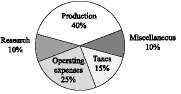
9. The following pie chart shows the budget for a local company. The total budget is $520,000.
Find the amount budgeted in the category of Research.
10. The table below gives the number of older (age 65 and older) foreign-born residents of the U.S. by region of birth in the year 2000.
|
Region
|
Population
|
|
Europe
|
1,200,000
|
|
Latin America
|
970,000
|
|
Asia
|
690,000
|
|
Other areas
|
240,000
|
Create a pie chart for the information
11.Find the five-number summary of the following set of numbers.
10, 4, 9, 12, 6, 11, 6, 2, 7, 6
Use the bar graph, showing the attendance at a circus for 7 days in September, for problems 12-13.12. Find the mean attendance over the 7 days.
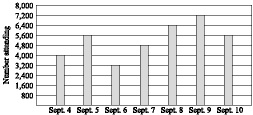
13. Find the median attendance over the 7 days.
14. Which of the following numbers are integers?
92,1.92,-1/2,-367,0.11
15. Place the following set of numbers in ascending order.
19, -13, 7, -5, 13, 3, 16
16. Evaluate |-59|-|-93|.
17. Subtract 7/9 - (-13/8).
18. Find the reciprocal of (-1/8)(32/8)(6)
19. (a) Divide -15/-3
(b) Divide 18/-9
20. Perform the indicated operation
13-9/(2)(4)-8