Complete the following:
Step 1: Write Section 1 of the DAA
- Include a definition of the specified variables (predictor, outcome) and corresponding scales of measurement.
- Specify the sample size of the data set.
Step 2: Write Section 2 of the DAA
Task: Analyze the assumptions of the t test.
|
Case Processing Summary
|
|
|
Cases
|
|
Valid
|
Missing
|
Total
|
|
N
|
Percent
|
N
|
Percent
|
N
|
Percent
|
|
gender
|
105
|
100.0%
|
0
|
0.0%
|
105
|
100.0%
|
|
gpa
|
105
|
100.0%
|
0
|
0.0%
|
105
|
100.0%
|
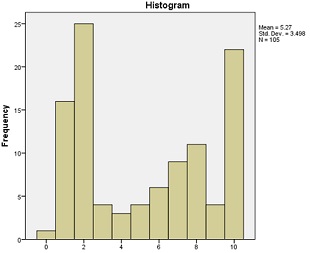
Task: Discuss your visual interpretations the SPSS histogram output for gpa.
|
Tests of Normality
|
|
|
Kolmogorov-Smirnova
|
Shapiro-Wilk
|
|
Statistic
|
df
|
Sig.
|
Statistic
|
df
|
Sig.
|
|
gender
|
.397
|
105
|
.000
|
.619
|
105
|
.000
|
|
gpa
|
.225
|
105
|
.000
|
.854
|
105
|
.000
|
|
a. Lilliefors Significance Correction
|
Task: Paste SPSS output for the Shapiro-Wilk test of gpa and interpret it.
|
Independent Samples Test
|
|
|
Levene's Test for Equality of Variances
|
t-test for Equality of Means
|
|
F
|
Sig.
|
t
|
df
|
Sig. (2-tailed)
|
Mean Difference
|
Std. Error Difference
|
95% Confidence Interval of the Difference
|
|
Lower
|
Upper
|
|
gender
|
Equal variances assumed
|
10.619
|
.002
|
-1.271
|
103
|
.207
|
-.149
|
.117
|
-.381
|
.083
|
|
Equal variances not assumed
|
|
|
-1.337
|
35.408
|
.190
|
-.149
|
.111
|
-.375
|
.077
|
|
gpa
|
Equal variances assumed
|
.154
|
.695
|
.831
|
103
|
.408
|
.698
|
.840
|
-.968
|
2.364
|
|
Equal variances not assumed
|
|
|
.848
|
33.961
|
.402
|
.698
|
.823
|
-.974
|
2.369
|
Task: Report the results of the Levene test and interpret it.
Task: Summarize whether or not the assumptions of the t test are met.
Step 3: Write Section 3 of the DAA
- Specify a research question related to gender and gpa.
- Articulate the null hypothesis and alternative hypothesis.
- Specify the alpha level.
Step 4: Write Section 4 of the DAA
|
Independent Samples Test
|
|
|
Levene's Test for Equality of Variances
|
t-test for Equality of Means
|
|
F
|
Sig.
|
t
|
df
|
Sig. (2-tailed)
|
Mean Difference
|
Std. Error Difference
|
95% Confidence Interval of the Difference
|
|
Lower
|
Upper
|
|
gender
|
Equal variances assumed
|
10.619
|
.002
|
-1.271
|
103
|
.207
|
-.149
|
.117
|
-.381
|
.083
|
|
Equal variances not assumed
|
|
|
-1.337
|
35.408
|
.190
|
-.149
|
.111
|
-.375
|
.077
|
|
gpa
|
Equal variances assumed
|
.154
|
.695
|
.831
|
103
|
.408
|
.698
|
.840
|
-.968
|
2.364
|
|
Equal variances not assumed
|
|
|
.848
|
33.961
|
.402
|
.698
|
.823
|
-.974
|
2.369
|
-
- Report the results of the SPSS output using proper APA guidelines .
- Include:
- t.
- Degrees of freedom.
- t value.
- p value.
- Effect size.
- Interpretation of effect size.
- Means and standard deviations for each group.
- Mean difference.
- 95% confidence interval of the difference of sample means.
- Interpret the results against the null hypothesis.
Step 5: Write Section 5 of the DAA
- Discuss the implications of this t test as it relates to the research question.
- Conclude with an analysis of the strengths and limitations of t test analysis.