Learning Outcomes:
1. Identify and explain the key ideas that define economic way of thinking and the maximisation of scarce resources.
2. Analyze how prices are determined in a market.
3. Compare and contrast the key characteristics of various market structures and market strategies adopted by firms in different market environments.
Problem 1:
(a) What is the assumption of a production possibilities frontier model?
(b) If the shape of the frontier is a straight line, what does the shape tell you?
(c) If the shape of the frontier is a curve bending outwards, what does the shape tell you?
(d) If the shape of the frontier is a curve bending inwards, what does the shape tell you?
(e) Why most of the PPFs are bending outwards? Explain using an example.
Problem 2:
What will happen to the equilibrium price and quantity of margarine market in each of the following cases? Illustrate with a diagram and explain whether demand or supply (or both) have shifted and in which direction. (In each case, assume ceteris paribus. Students are allowed to make appropriate assumptions on the relationship between the goods).
(a) A fall in the price of margarine;
(b) A fall in the demand for yoghurt;
(c) A fall in the price of bread;
(d) A rise in the supply for bread;
(e) An expected fall in the price of butter in the near future;
(f) A tax on butter production;
Problem 3:
a) When the price of Orange increases from $3/kg to $3.5/kg the quantity sold decreases from 240kg per day to 200kg per day. Calculate the price elasticity coefficient for Orange.
b) Describe the relationship between the price and the total revenue for elastic, inelastic and unit elastic demand respectively. Use diagrams to illustrate the relations you have described.
c) Opponents of increasing of the tax on sellers of cigarettes argue that the big tobacco companies just pass the tax along to the consumers. Do you agree or disagree? Use suitable diagrams explain your answer.
Problem 4:
(a) Explain and illustrate using suitable diagram, the impact of external costs using the example of carbon emission in coal fired electricity production, and explain what policy measures can be used to deal with the external effect in order to obtain socially efficient allocation of resource
(b) Explain and illustrate using suitable diagram, the impact of external benefits on resource allocation using the example high education, and explain what policy measures can be used to deal with external effects in order to obtain socially efficient allocation of resource
(c) List two public goods or service and two private good and service and explain why these goods or service become public goods or service.
Problem 5:
Consider the demand function and supply function of widgets to be:
Qd = 100 - P (1)
Qs = 4P (2)
a) What is the market equilibrium based on the equation (1) and equation (2)?
b) Calculate the consumer and producer surplus at the market equilibrium. What is the total surplus?
c) Using equation (1) and equation (2), sketch the demand and supply diagram and indicate your results from parts a) and b). Correctly label the diagram.
Problem 6:
You run a painting company with a total fixed cost of $20 and the following schedule for total cost:
|
Output
|
Fixed Cost
|
Variable Cost
|
Total Cost
|
Average Fixed
|
Average Variable
|
Average Total Cost
|
Marginal Cost-
|
|
Cost-AFC
|
Cost-AVC
|
-ATC
|
MC
|
|
0
|
|
|
20
|
|
|
|
|
|
1
|
|
|
22
|
|
|
|
|
|
2
|
|
|
28
|
|
|
|
|
|
3
|
|
|
38
|
|
|
|
|
|
4
|
|
|
52
|
|
|
|
|
|
5
|
|
|
70
|
|
|
|
|
|
6
|
|
|
92
|
|
|
|
|
a) Complete the table by calculating total variable cost (TVC); average fixed cost (AFC), average variable cost (AVC); average total cost (ATC); and marginal cost (MC) for each quantity.
b) Draw graph of costs (all in the same graph) for AFC, AVC, ATC and MC.
c) Describe the shapes of the AFC, ATC, AVC and MC, and explain what leads to the shapes.
d) Describe the relations between the MC and the ATC and AVC, and explain the reasons leading to the relations.
e) Do we have the law of diminishing returns in this example?
Problem 7:
The following diagram shows the cost curves of a firm under perfect competition.
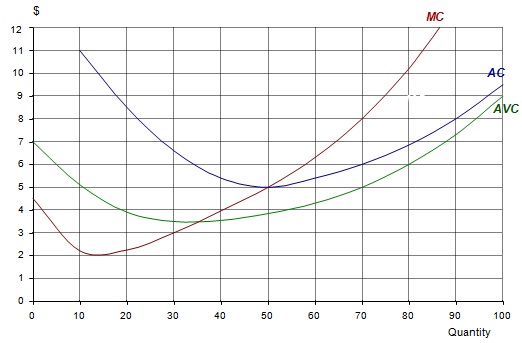
(a) How much will the firm produce in order to maximize profits at a price of $8 per unit?
(b) What will be its average cost of production at this output?
(c) How much (supernormal) profit will it make?
(d) How much will the firm produce in order to maximize profits at a price of $5 per unit?
(e) How much (supernormal) profit will it make?
(f) How much will the firm produce in order to maximize profits at a price of $4 per unit?
(g) What will be its profit position now?
(h) Below what price would the firm shut down in the short run?
(i) Below what price would the firm shut down in the long run?
Problem 8:
A monopolist is faced with the following cost and revenue curves
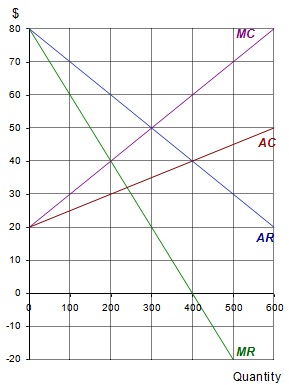
(a) What is the maximum-profit output?
(b) What is the maximum-profit price?
(c) What is the total revenue at this price and output?
(d) What is the total cost at this price and output?
(e) What is the level of profit at this price and output?
(f) If the monopolist were ordered to produce 300 units, what would be the market price?
(g) How much profit would now be made?
(h) If the monopolist were faced with the same demand, but average costs were constant at $60 per unit, what output would maximize profit?
(i) What would be the price now?
(j) How much profit would now be made?
Problem 9:
(a) Illustrate with diagrams and explain how a perfectly competitive firm and monopolist differ in their allocative efficiencies;
(b) Illustrate with a diagram and explain the long-run perfectly competitive equilibrium for the firm.
Approach our industry best professional Economics Assignment Help tutors and grab the opportunity to become the next topper of your class, without any trouble.
Tags: Economics Assignment Help, Economics Homework Help, Economics Coursework, Economics Solved Assignments, Production Possibilities Frontier Model Assignment Help, Production Possibilities Frontier Model Homework Help, Price Elasticity Assignment Help, Price Elasticity Homework Help