--%>

Simplified demonstration of Littles Law

Simplified demonstration of Little’s Law:

1874_little law.jpg


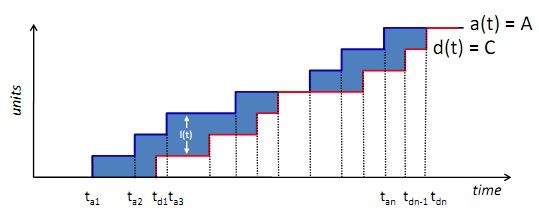
• a(t): the number of arrivals up to time t
• d(t): the number of departures up to t
• l(t) = a(t) –d(t) ≥ 0, the number of units in the system at time
• H(t): the area enclosed between the curves a(t) & d(t). represents the accumulated time in system during that interval measured in request-seconds (or request-minutes, etc.)

Simplified demonstration:

L ≡ H/T

R ≡ H/C

X ≡ C/T

H/T ≡ (C/T) (H/C);

L = X/R

   Related Questions in Basic Statistics

  • Q : Problem on queuing diagram Draw a 

    Draw a queuing diagram for the systems below and describe them using Kendall’s notation: A) Single CPU system <

  • Q : Report on Simple Random Sampling with

    One of my friend has a problem on simple random sampling. Can someone provide a complete Report on Simple Random Sampling with or without replacement?

  • Q : Decision Variables Determine Decision

    Determine Decision Variables: Let X1 be the number of private homes to be inspectedLet X2 be the number of office buildings to be inspect

  • Q : Probability how can i calculate

    how can i calculate cumulative probabilities of survival

  • Q : State the hypotheses At Western

    At Western University the historical mean of scholarship examination score for freshman applications is 900. Population standard deviation is assumed to be known as 180. Each year, the assistant dean uses a sample of applications to determine whether the mean ex

  • Q : Principles of data analysis For the

    For the data analysis project, you will address some questions that interest you with the statistical methodology we are learning in class. You choose the questions; you decide how to collect data; you do the analyses. The questions can address almost any topic,

  • Q : Data Description 1. If the mean number

    1. If the mean number of hours of television watched by teenagers per week is 12 with a standard deviation of 2 hours, what proportion of teenagers watch 16 to 18 hours of TV a week? (Assume a normal distribution.) A. 2.1% B. 4.5% C. 0.3% D. 4.2% 2. The probability of an offender having a s

  • Q : Use the NW corner rule to find an

      (a) Use the NW corner rule to find an initial BFS, then solve using the transportation simplex method. Indicate your optimal objective function value. (b) Suppose we increase s1 from 15 to 16, and d3 from 10 to 11. S

  • Q : Define SPIN simulation modes SPIN: •

    SPIN: • SPIN generates C program that is the model checker – The pan verifier • Process Analyzer – Run the pan executable to do the model check

  • Q : Derived quantities in Queuing system

    Derived quantities in Queuing system: • λ = A / T, Arrival rate • X = C / T, Throughput or completion rate • ρ =U= B / T, Utilization &bu