Relationship between Total utility and Marginal utility
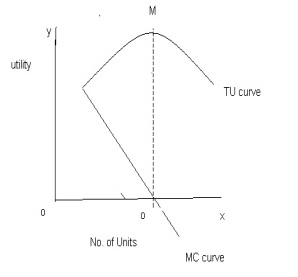
Describe the relationship between Total utility (TU) and Marginal utility (MU)? Answer: a) TU rises at diminishing rate whenever MU is declining and Positive. b) TU is maximum whenever MU is 0 (Zero).c) Whenever MU becomes Negative, TU refuses.
Describe the relationship between Total utility (TU) and Marginal utility (MU)?
Answer:
a) TU rises at diminishing rate whenever MU is declining and Positive. b) TU is maximum whenever MU is 0 (Zero).c) Whenever MU becomes Negative, TU refuses.
When the relative positions of all affects on costs and revenues are the same for all the several firms in this industry, in that case this firm is most likely operating in a: (w) differentiated oligopoly market in the short run. (x) monopolistically
Short-run supply curve of a purely competitive firm’s is the positively sloped part of the marginal cost curve which is above its: (w) average fixed cost curve. (x) resource demand curve. (y) average variable cost. (z) short-run
When there is no minimum legal wage in market for unskilled labor, approximately: (w) 6,000 unskilled workers would earn about $5 per hour. (x) 3,000 unskilled workers would earn about $8 per hour. (y) 4,500 unskilled workers would ea
This alters in the supply- and demand-curves for textbooks could not have resulted from a change in: (w) taxes. (x) relative prices for text books. (y) expectations about future prices. (z) prices for related goods.
Can someone please help me in finding out the accurate answer from the following question. The monopsony is a: (1) Market with just one seller. (2) Sole buyer of a specific good or resource. (3) Market with just one product. (4) Firm which employs just one resource.
When increased demand causes the price of main beluga caviar to climb from $2750 to $3250 per pound and consequently world production rises from 24 to 40 tons yearly, its caviar has a price elasticity of supply approx
When the resource market shown in this illustrated figure is initially within equilibrium along with demand curve D0: (w) owners of these resources currently receive no economic rents. (x) economic rent is specified by area
Joseph A. Schumpeter popularized and refined the concept that profits: (i) ultimately derive primarily from innovation. (ii) are necessary compensation to entrepreneurs for bearing uncertainty. (iii) are reduced by bureaucratic inefficiencies in firms
settlement range between management and the trade union
The elasticity of demand equals one and consumer spending upon Robot Butlers (there is the firm’s total revenue), is at a maximum at a price of as: (1) $20,000. (2) $15,000. (3) $10,000. (4) $5,000. (5) zero. Discover Q & A Leading Solution Library Avail More Than 1451753 Solved problems, classrooms assignments, textbook's solutions, for quick Downloads No hassle, Instant Access Start Discovering 18,76,764 1959147 Asked 3,689 Active Tutors 1451753 Questions Answered Start Excelling in your courses, Ask an Expert and get answers for your homework and assignments!! Submit Assignment
18,76,764
1959147 Asked
3,689
Active Tutors
1451753
Questions Answered
Start Excelling in your courses, Ask an Expert and get answers for your homework and assignments!!