--%>

Reduction in quantity

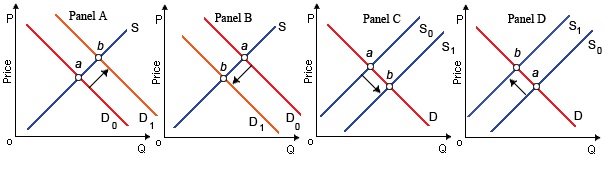
When equilibrium moves from point a to point b in the figure shown below, the only market experiencing a reduction in quantity supplied is illustrated in: (1) Panel A. (2) Panel B. (3) Panel C. (4) Panel D.

2442_5.jpg

Can someone help me in getting through this problem.

   Related Questions in Macroeconomics

  • Q : Invesstment multiplier what can be the

    what can be the minimum value of investment multiplier?

  • Q : Potential GDP The hypothetical

    The hypothetical information in the following table shows what the economic situation will be in 2015 if the Fed does not use monetary policy: Year Potential GDP Real GDP Price Level 2014 $15.2 trillion $15.2 trillion 110.0 2015 $15.6 trillion $15.8 trillion

  • Q : Paradox of Value-High values of

    The fact that most of the necessities for life like water are priced much lower than the frivolities like diamonds is addressed by the: (1) Utilitarian enigma. (2) Law of diminishing marginal utility. (3) Rational ignorance of hypothesis. (4) Paradox of the value. (5)

  • Q : Diminishing prices raising total revenue

    Diminishing prices will raise total revenue from DVD game sales at each and every price: (1) On this demand curve. (2) Beneath $25. (3) Above $25. (4) Beneath $30.

    Q : Equilibrium The equilibrium interest

    The equilibrium interest rate is determined

  • Q : How commercial bank make money How does

    How does a commercial bank make money? Answer: Commercial banks are capable to make credit that is many times greater than deposits received by banks. Money creatio

  • Q : Market Economy Explain the statement "

    Explain the statement "Hypothes is the basic short run and long run behaviors of the airline industry in a market economy".

  • Q : Signals that guide economic decisions

    In market economies, what are the signals which guide economic decisions?

  • Q : Transfer of wealth problem The transfer

    The transfer of wealth from developed countries to oil exporting countries (abbreviated as OPEC) which followed sky-rocketing oil prices in the year 1970s points out that the price elasticity of demand for oil was: (i) Unitary. (ii) Relatively high. (

  • Q : Project Include graphs and should be 15

    Include graphs and should be 15 pages long