--%>

Question related to Monopoly

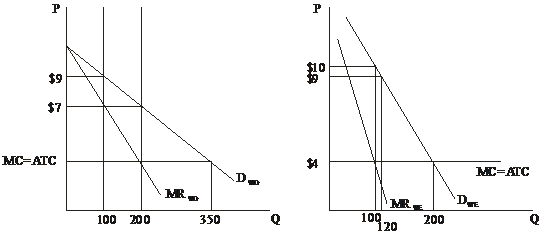
Refer to the following figure . Assume the graphs represent the demand for use of a local golf course for which there is no significant competition (it has a local monopoly); P indicates the price of a round of golf; Q is the quantity of rounds "sold" each day. If the left graph depictes the demand during weekdays, and the right graph the weekend demand, this profit-maximizing golf course will earn how much economic profit over the course of a full seven-day week? A) $4200 B) $3700 C) $3400 D) $2700

2383_hgfdds.png

   Related Questions in Microeconomics

  • Q : Marginal revenue of purely competitive

    When boosting output by hundred units raises total revenue by $1200, in that case a purely competitive firm’s marginal revenue the same as: (w) $1,200. (x) $120. (y) $12. (z) $120,000. I need a good answer on

  • Q : Cost conditions and market demand curve

    The fact that a firm along with market power adjusts output depending upon both cost conditions and the features of the market demand curve means that: (w) the amount which a monopolist produces tends to be more volatile than the outp

  • Q : Import car market in equilibrium before

    While the import car market is in equilibrium before the government restricts car imports to Q1, the price which buyers will pay for an import as: (1) falls from P0 to P1. (2) is stable, although dealer profits fall by

  • Q : Wealth distribution by income When line

    When line 0C0' shows the 2005 U.S. income distribution, in that case the line that would shows the 2005 wealth distribution would be probably line: (1) line 0A0'. (2) line 0B0'. (3) line 0C0'. (4) line 0D0'. (5) line 0E0'.

  • Q : Scope of spiral and waterfall approach

    Explain the difference in changing the scope between a spiral approach and a waterfall approach?

  • Q : History of Labor Union problem Can

    Can someone help me in finding out the right answer from the given options. Working time gone in strikes as the percent of net working time in the United States since from the end of World War II has: (1) Rose to around 20 percent. (2) Reduced to a bit over 6 percent.

  • Q : Marginal Productivity Theory of Income

    The income distribution into a market economy is primarily found by differences within: (1) effort and sacrifice alone. (2) resource ownership and resource prices. (3) birth and social standing. (4) Lorenz coefficients. (5) political

  • Q : Changes in total revenue by price falls

    When the price falls along such demand curve for pizza, in that case total revenue: (w) falls. (x) rises, then falls. (y) rises. (z) does not change.

    Q : Measurement of cross-elasticity of

    The cross-elasticity of demand measures as: (1) the changes in quantities sold when the price of related good changes. (2) changes within the prices of substitute goods. (3) changes within the prices of complementary goods. (4) how quantities sold cha

  • Q : Resources flowing toward industries in

    Resources tend to flow toward industries in the long run along with: (w) lower profits for typical firms. (x) more profit for typical firms. (y) lower payments to most resource owners. (z) more stable rates of technological change.

    Discover Q & A

    Leading Solution Library
    Avail More Than 1452639 Solved problems, classrooms assignments, textbook's solutions, for quick Downloads
    No hassle, Instant Access
    Start Discovering

    18,76,764

    1959303
    Asked

    3,689

    Active Tutors

    1452639

    Questions
    Answered

    Start Excelling in your courses, Ask an Expert and get answers for your homework and assignments!!

    Submit Assignment

    ©TutorsGlobe All rights reserved 2022-2023.