Question on production possibilities curve
Refer to the given diagram. Which of the following positions relative to PP1 would be the most likely to result in a future production possibilities curve of PP3, rather than PP2 ? 1) A. 2) B. 3) C. 4) D. Help me in getting through above question
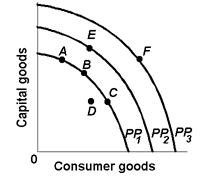
Refer to the given diagram. Which of the following positions relative to PP1 would be the most likely to result in a future production possibilities curve of PP3, rather than PP2 ? 1) A. 2) B. 3) C. 4) D.
Help me in getting through above question
A competitive industry is in long-run equilibrium only after: (w) net pressure for entry or exit is zero. (x) each firm produces to its capacity. (y) owners reap all the profits they desire. (z) union bosses and firm managers reach mutual agreements.<
An oligopoly will maximize profits when this produces where: (w) MR > MC. (x) MR = MC. (y) TR = TC. (z) MR > P. Can anybody suggest me the proper explanation for given problem regarding Economics
Describe what do you mean by the term Yield to Maturity?
Can someone help me in finding out the right answer from the given options. The law of diminishing marginal utility might be evidenced by the person: (i) Smoking more however enjoying each and every extra cigarette less. (ii) Buying a latest car after
John Kenneth Galbraith refuses theories which suppose profit maximization in competitive markets. According to him, the big corporations dominate the economic activity as: (1) Corporate managers look for maximum gains for stockholders. (2) Government policies are mani
Since demands for resources eventually depend upon consumers’ demands for goods, in that case the demand for labor is: (w) termed as a derived demand. (x) a perfectly elastic demand curve. (y) a perfectly inelastic demand. (z) a horizontal line.
I have a problem in economics on demand-Purchasing goods. Please help me in the following question. The quantity of good consumers will purchase beneath different conditions are termed as consumer: (i) Requirements. (ii) Entitlements. (iii) Wants. (iv
In the year 2015, people begin utilizing dollar bills to wipe up messes as hyperinflation has driven the price of ‘real’ paper towels to $7,000 a roll. This is an illustration of: (1) The income result. (2) Diminishing the marginal utility
Can someone help me in finding out the right answer from the given options. The employer with monopsony power exploits the labor if it pays a wage: (i) At a bare subsistence level. (ii) That stabilizes worker population. (iii) Less
Describe why the equilibrium price of commodity is determined at the level of output at which its demand equavalents its supply.
18,76,764
1947247 Asked
3,689
Active Tutors
1447152
Questions Answered
Start Excelling in your courses, Ask an Expert and get answers for your homework and assignments!!