--%>

Output level of profit maximizing of competitive firm

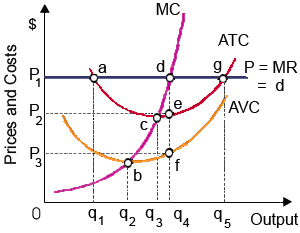
The profit maximizing competitive firm in illustrated graph will: (i) produce output level q5. (ii) minimize total costs by producing output level q3. (iii) experience fixed costs equal to 0P3fq4. (iv) produce output level q4. (v) inevitably experience economic losses.

1858_Total Revenue1.png

How can I solve my Economics problem? Please suggest me the correct answer.

   Related Questions in Microeconomics

  • Q : State Statutory liquidity ratio or SLR

    State SLR (or Statutory liquidity ratio): It is the ratio of net or total demand and time deposits of commercial bank that, it has to keep in the form of specified liquid assets.

  • Q : Special characteristic of firms in an

    The special characteristic of firms within an oligopoly NOT determined in other market structures is: (i) homogeneity of product. (ii) interdependence that is mutually recognized. (iii) restricted entry. (iv) a high degree of market power. (v) perfect

  • Q : Demand curve facing each firm Question:

    Question: (1) Suppose the jeans industry is an oligopoly in which each firm sells its own distinctive brand of jeans, and each firm believes its rivals will not follow its price increases but will

  • Q : What is Budget line Budget line : This

    Budget line: This refers to all combinations of goods that a consumer can purchase with his whole income and price of two goods.

  • Q : Restrictive monetary policy Select the

    Select the right answer of the question. A restrictive monetary policy is designed to shift the: A) aggregate demand curve rightward. B) aggregate demand curve leftward. C) aggregate supply curve rightward. D) aggregate supply curve leftward

  • Q : Goals of the Firm-Profit Maximization

    The supposition that firms try to maximize the profits: (i) Is the beginning point for most of the economic analyses of how firms function. (ii) Can be wrong for the cases in which the professional corporate managers maximize their own self interests rather than the i

  • Q : Relative utility-Consumer Equilibrium

    Can someone please help me in finding out the accurate answer from the following question. The relative utility from the last dollar used up on food is the ratio: (i) Marginal utility of food or production cost of food. (ii) The Price of food or net grocery bill. (iii

  • Q : Various kinds of capital goods Supply

    Supply curves for different kinds of capital goods are usually: (w) perfectly elastic. (x) perfectly inelastic. (y) upward sloping. (z) downward sloping. Can anybody suggest me the proper explanati

  • Q : Perfectly price elasticity of supply

    The supply of textile employees in China is possibly most like the perfectly price elastic supply curve within: (w) Panel A. (x) Panel B. (y) Panel C. (z) Panel D.

    Q : Market adjustments through a scarce good

    Within below figure there is market for papayas: (1) a shortage exists at P2. (2) papayas are a free good at P0. (3) papayas are currently a scarce good. (4) consumer's demand prices equivalent P2 at quantity Q2. (5) the equ