--%>

Long-run supply curve in constant cost industry

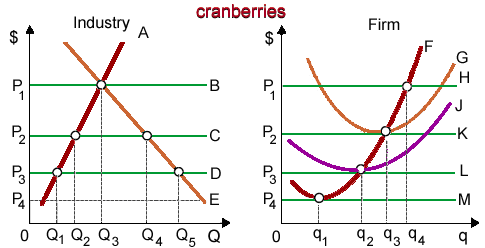
When cranberries are a constant cost industry and that firm is typical, in that case the industry’s long-run supply curve is curve as: (i) curve A. (ii) curve B. (iii) curve C. (iv) curve D. (v) curve E.

868_demand and supply.png

Please choose the right answer from above...I want your suggestion for the same.

   Related Questions in Microeconomics

  • Q : Federal minimum wage rose over

    The LEAST likely outcome, when the federal minimum wage is increased $1 over the equilibrium wage rate, that would be for the: (w) unemployment rate of teenagers and unskilled workers to rise. (x) quantity of unskilled workers supplie

  • Q : Increase profit of cartel-member A

    A member of a cartel would be probably to increase its profits by: (1) undercutting the prices of other cartel members when this did not get caught. (2) setting its price above which of other cartel members. (3) aggressive nonprice marketing promotion

  • Q : Perpetuity bond in fixed cash flows A

    A perpetuity is a: (w) financial asset which provides its owner eternal life. (x) perpetual motion machine which lasts forever. (y) bond which pays its owner an annual income forever. (z) profitable share in an established corporation. 

    Q : When is not total annual revenue

    As per this demonstrated figure in below, unless something changes the total annual revenue of Robot Butlers, Inc. Can’t exceed: (1) $10,000. (2) $20,000. (3) $100 million. (4) $200 million. (5) $400 million.

  • Q : Expectations of price fall during sales

    Can someone help me in finding out the right answer from the given options. Pam’s expectations that the costs of shoes are going to drop all through forthcoming clearance sales will lead, in the short run, to a/an: (i) Reduction in her demand for shoes. (ii) Red

  • Q : Perspective of Sociologists and

    Far more than economists and sociologists tend to emphasize human needs for power, status, and class. Research which supports the perspective of sociologists comprises findings that: (1) people whose incomes are the average of per capita world income

  • Q : Problem on Substitution effect for good

    One of my friend has a problem on substitution effect. The original equilibrium point (that is utility-maximizing bundle) in the graph shown below is at point A. The price of good Y is increased, pivoting the budget constraint down to its latest level.a. F

  • Q : Socially optimal output in perfectly

    Assume that no externalities in production or consumption exist and the income distribution is universally viewed such as “fair.” When this firm could price discriminate perfectly, one condition for socially optimal output would be for: (i

  • Q : Effect of total revenue on economic loss

    The economic loss occurs whenever total revenue: (i) Is equivalent to the total costs. (ii) Fails to cover the opportunity costs. (iii) Surpasses opportunity costs. (iv) Surpasses the explicit costs. Can someone please help me in f

  • Q : Isoquants and isocost lines By using

    By using isoquants and isocost lines, illustrates graphically that rise in y will result in a decline in the quantity demanded of x1 and also illustrates that rise in the price of x1 will result in a reduction in the quantity demanded of x1<